Unable to see Watchers in the Sentinl Watcher Table #469
Comments
|
Could you confirm if you are using any authentication mechanism? Also grab the Kibana logs as you save the watcher, they should reveal some sort of error response while attempting to store data. |
|
Hi, Best |
|
I see no useful info in the Kibana log you posted. Do you see the created watcher in the You can also specify a field value to narrow search |
|
Do you see any error in your browser dev console when adding a watcher? |
|
This is dev Console Logs ""http://192.168.10.121:5601/app/sentinl"},"res":{"statusCode":200,"responseTime":13,"contentLength":9},"message":"GET /api/saved_objects/?type=senti |
|
this is output of the Curl Command "{"took":1,"timed_out":false,"_shards":{"total":1,"successful":1,"skipped":0,"failed":0},"hits":{"total":0,"max_score":null,"hits":[]}}" |
This seems to be the core issue, and its a cluster one apparently? does this message appear in the Elasticsearch logs too? |
|
Hi Loranzo, |
|
Hi Sergi, There is no sentinl watcher in .kibana index. Does it stores the watchers in .kibana? Sentinl 2 used to store watchers in an index called "Watcher" |
|
It is working fine for below configuration: But not working for: |
Yes, Sentinl currently stores only in .kibana index. Here are the details #408 @aashish051218 please show me you kibana.yml, sentinl config part. |
|
Hi Sergii, |
|
Hi Sergii, Best |
|
Hi @aashish051218 , If your watcher is getting created successfully but still not able to see in the watcher list in sentinl, then you need to increase the "results" in kibana.yml. Let me know if you still face the same issue. |
|
I also face this problem.Can not see the setted watcher lists in sentinl.But the watcher job work normal. |
Hi @aashish051218 , Note: set the results values around 1000, if you believe that there will be almost 1000 sentinl alerts. Reference: https://sentinl.readthedocs.io/en/latest/Config-Example/ The results value show how many sentinl alerts who want to see in Sentinl dashboard. Let me know if you are still unable to see the alert. |
I set parameters follows:but unable to see the sentinl watcher
sentinl: sentinl: |
|
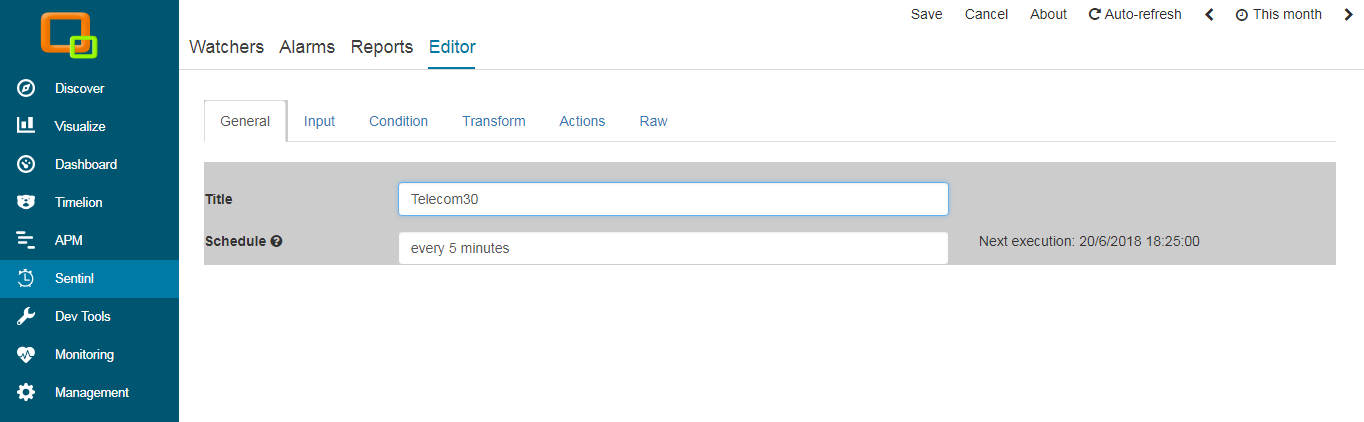
Hi @aashish051218 , You are not following my instruction. Please refer the last comment from me. You will understand the issue. Also, you can refer the attached snapshot for your reference. Make sure you restart Kibana after making the changes in kibana.ym
|

Hello, sentinl: had the error:(the kibana server work ok.and the old sentinl job work nomal too) |
|
Hi @aashish051218 , Apology for the confusion. I just wanted you to add "results" field in your kibana.yml. (Do not add any other things in your kibana file). Kindly revert it and just add "results" field in the existing kibana file which was working fine previously(like below)
Make sure you restart kibana after the change. |
|
Fix readme. Sync commit from public branch
I am using ES version 6.2.3, Kibana version 6.2.2
Issue description
Even though it says that the watcher is successfully created, I still do not see the same in the watcher table
Reproducing the issue step-by-step

Can somebody please help me out?
The text was updated successfully, but these errors were encountered: