updated 30 January 2023

https://siriusbontea.github.io/roman-empire/
-
This project provides an interactive mapping visualisation of Roman territorial expansion from 500 B.C. to A.D. 200. The primary focus is on Roman roads as it correlates to the growth of the empire. The Roman road network directly contributed to commerce, ease of travel, and enabled rapid movement of Roman armies and logistical resupply.
-
Why Roman roads anyway? They're longer-lasting than modern roads! Some of these ancient roads didn't see much degradation until tanks rolled over them during World War 2, but even so, the roads were still in decent shape after the fact. Furthermore, Roman roads were marvels in engineering in terms of placement and would give the modern surveyor the run for their money if there was a contest of who could make a straighter road far over the horizon.
-
This project was built to meet requirements for Modules 8-10 of the MAP 673: Design For Interactive Web Mapping course at the University of Kentucky.
- All software tools ran on a basic laptop with the FreeBSD 13.1-RELEASE operating system:
MSI Pulse GL66 laptop w/ external monitor
CPU: 11th Gen Intel i7-11800H (16) @ 2.304GHz
GPU: GeForce RTX 3070 Mobile / 8192MiB
Memory:  65204MiB
-
QGIS 3.26.2- Buenos Aires performed most of the heavy lifting behind the scenes with vector layer creation, editing, analysis, and processing of data prior to use for web mapping. Georeferencing of raster data, such as scans of hand-drawn maps, will be done with QGIS.
-
VS Code - code editing and interaction with GitHub
-
GIMP - General editing and processing of raster images
-
Inkscape - General editing of SVGs data
-
GeoJSON - file format for most map data
-
CSV - file format for some of the map data (to save on file size if necessary)
-
HTML, CSS, JS
- Leaflet - Primary JS library for mapping requirements, user interface, etc.
- PapaParse and omnivore - JS libraries for processing CSV data for use with Leaflet
- Bootstrap - JS/CSS library for general layout, theme, and styles
-
Github Pages (maybe Mapbox?)
-
Adobe Stock Photos (SVGs for map icons, etc.)
-
Convertio was used to convert Adobe Illustrator (.ai) files to SVG.
-
possibly other hosting service for larger data (i.e., map tiles).
-
Roman roads, aqueducts, bridges (ShapeFiles) from the Ancient World Mapping Center. -
Ultimately, AWMC's shapefile directory has a decent collection of political maps showing the Roman Empire at various extents (from 60 B.C. to A.D. 200). However, the shapefiles were crude and did not align with shapefiles from Natural Earth's 10m Physical Vectors, nor did they align to major natural physical barriers such as large rivers. Furthermore, I was unable to locate vector files for the Early Roman Republic.
-
Due to these shortfalls, I used QGIS to create the vector files I needed and align them with the Natural Earth vector files.1 I referred to the various reference maps (see list below) to create additional vector files for the following time periods:
- 500 B.C. extent
GeoJSON - 338 B.C. extent
GeoJSON - 298 B.C. extent
GeoJSON - 290 B.C. extent
GeoJSON - 272 B.C. extent
GeoJSON - 264 B.C. extent
GeoJSON - 218 B.C. extent
GeoJSON - 133 B.C. extent
GeoJSON2 - 60 B.C. extent
GeoJSON - A.D. 14 extent
GeoJSON - A.D. 69 extent
GeoJSON - A.D. 117 extent
GeoJSON - A.D. 200 extent
GeoJSON - Max extent
GeoJSON3
- 500 B.C. extent
Notes:
1 Some of these vector files, are still a bit rough (in my opinion), and will be further refined.
2 There are inconsistencies for the 133 B.C. maps depending on the source material and will be the highest priority for revision.
3 The "Max extent" vector file is not to be used to denote a particular time period, but rather to be used for clipping/intersection work within QGIS. For example, regions in Mesopotamia and Germania Magna were temporary holdings at best or areas of Roman influence due to road/trade networks (and not necessarily Roman conquered territories).
-
Combined 500 B.C. through A.D. 117 TopoJSON
-
In essence, I built custom polygons because the ones on the web failed to take into account terrain features. Below, we can see the standard shapefile posted all over the interwebs that, unfortunately, don't take into account terrain:

- And, here's my interpretation of what the historical Roman boundary should really look like:

-
In the early stages of the Roman Republic's expansion across the Italian peninsula, it is simply not realistic to think that Rome would prefer to gain control of mountainous alpine terrain over the fertile Po river valley. The old map files were an eye sore and badly needed fixing!
-
The data I've generated here is released under the BSD 3-Clause License. So, if there are more fixes to be made, go for it! Or just do whatever you want. It's BSD. :-)
-
Roman Roads data used in this project is derived primarily from the Digital Atlas of Roman and Medieval Civilization Dataverse but combined with data from Mercator-E Project to add to the Hispania region, and VOL. 4 THE ROADS Fasc. 4.1 NOTES ON THE ITINERARIA to add to some of the missing segments in the Asia Minor region. The dataset from The Roads of Roman Britain was not incorporated, not because it was lacking — rather the opposite as it had more detail compared to all of the other datasets. If interested in Roman Roads in Britannia specifically, be sure to check out their highly detailed research.
-
Project MERCURY-MINERVA-SIMREC (Computational Modeling in Roman Studies)
-
Juxtaposing GIS and Archaeologically Mapped Ancient Road Routes PDF - Journal article by Paddington Hodza and Kurtis A. Butler at the Wyoming Geographic Information Science Center, the University of Wyoming outlining some of the many challenges with the mapping of archaeological road networks with GIS.
This study provides a portable, digital version of the Roman roads identified in the Barrington Atlas, which users can visualize in combination with their own historical data. (2008)
- Citation:
- McCormick, Michael; Huang, Guoping; Zambotti, Giovanni; Lavash, Jessica, 2013, "Roman Road Network (version 2008)", https://doi.org/10.7910/DVN/TI0KAU, Harvard Dataverse, V1
-
Data from Klokantech Github which was derived from data from the Centre for Digital Humanities, University of Gothenburg and made into GeoJSON files:
- places_high GeoJSON
- places_medium GeoJSON
- places_low GeoJSON
- places_subsites GeoJSON
- fortifications GeoJSON
- 10m_lakes_label GeoJSON
- 10m_lakes GeoJSON
- 10m_rivers_lakes_centerlines GeoJSON
| Type Identifier | Description | Zoom |
|---|---|---|
| 11 | Major settlement (capital, colonia, municipium) | 6 |
| 17 | Major fort (legionary fortress) | 6 |
| 13 | Civitas capital (Late Roman Gallia) | 8 |
| 12 | Settlement (civitas, vicus, other settlement) | 8 |
| 18 | Fort (castrum, castellum) | 8 |
| 53 | Fortlet, tower | 10 |
| 16 | Road or coastal station | 8 |
| 31 | Iron Age (Celtic) Oppidum | 9 |
| 35 | Late Roman Oppidum | 9 |
| 19 | Oasis | 9 |
| 61 | Sanctuary or temple | 9 |
| 66 | Bath | 9 |
| 32 | Tumulus | 10 |
| 63 | Cemetery | 10 |
| 21 | Monastery | 10 |
| 24 | Church | 10 |
| 14 | Villa | 10 |
| 57 | Mine, quarry or production | 10 |
| 49 | Pass | 10 |
| 51 | Bridge | 10 |
| 55 | Road/milestone | 10 |
| 52 | Aqueduct/dam/cistern/spring | 10 |
| 64 | Monument | 10 |
My "Plain Terrain" Map created with Mapbox
The Wandering Cartographer (Digital Atlas of the Roman Empire) Article on how to add the Digital Atlas of the Roman Empire (DARE) basemap to QGIS.
-
Font selection for this project attepts to be as close to authentic Roman inscriptions as possible. The Trajan font from the Adobe Font Collection is based upon the carved inscription on the Trajan column at the Basilica Ulpia in the Forum of Trajan and depicts the Emperor Trajan's own account of his conquest of Emperor Trajan’s own account of his compaigns leading to the conquest of Decebalus (A.D. 101 - 102) and the annexation of Dacia (A.D. 105 - 106).
-
Colours are based on the dyes used by the Romans which often had symobolism in mind. Additionally, materials such as parchment are normally much brighter when newly made compared to the darker hues we see in museums due to aging. Due to variability in the dyes, pigments, and materials used, its nearly impossible to create a perfect match on a webpage. However, I'll do the best I can to provide a close approximation.
-
A mobile-friendly responsive Leaflet map will be means to deliver content.
-
The map will use a "time slider" and infrastructure "layers" that can be toggled. This interactivity afforded to the user is to assist in visualisation of these changes (i.e., expansion of Roman infrastructure) and hopefully show the importance of the role of lines of communication and how it correlates with the increase in trade and expansion of the empire.
-
Popups over key locations will provide the user with additional information, links, and graphics.
-
custom icons will be used to represent key locations (major cities, key terrain), location types (forts, towns), cultural areas (tribal locations), politcal boundaries (provicial areas).
- Link to draft mock-up PDF
- OmniAtlas (Category: Roman Empire)
- David Rumsey Map Collection
- Roman Empire
- Tab. XII. Imperium Romanum
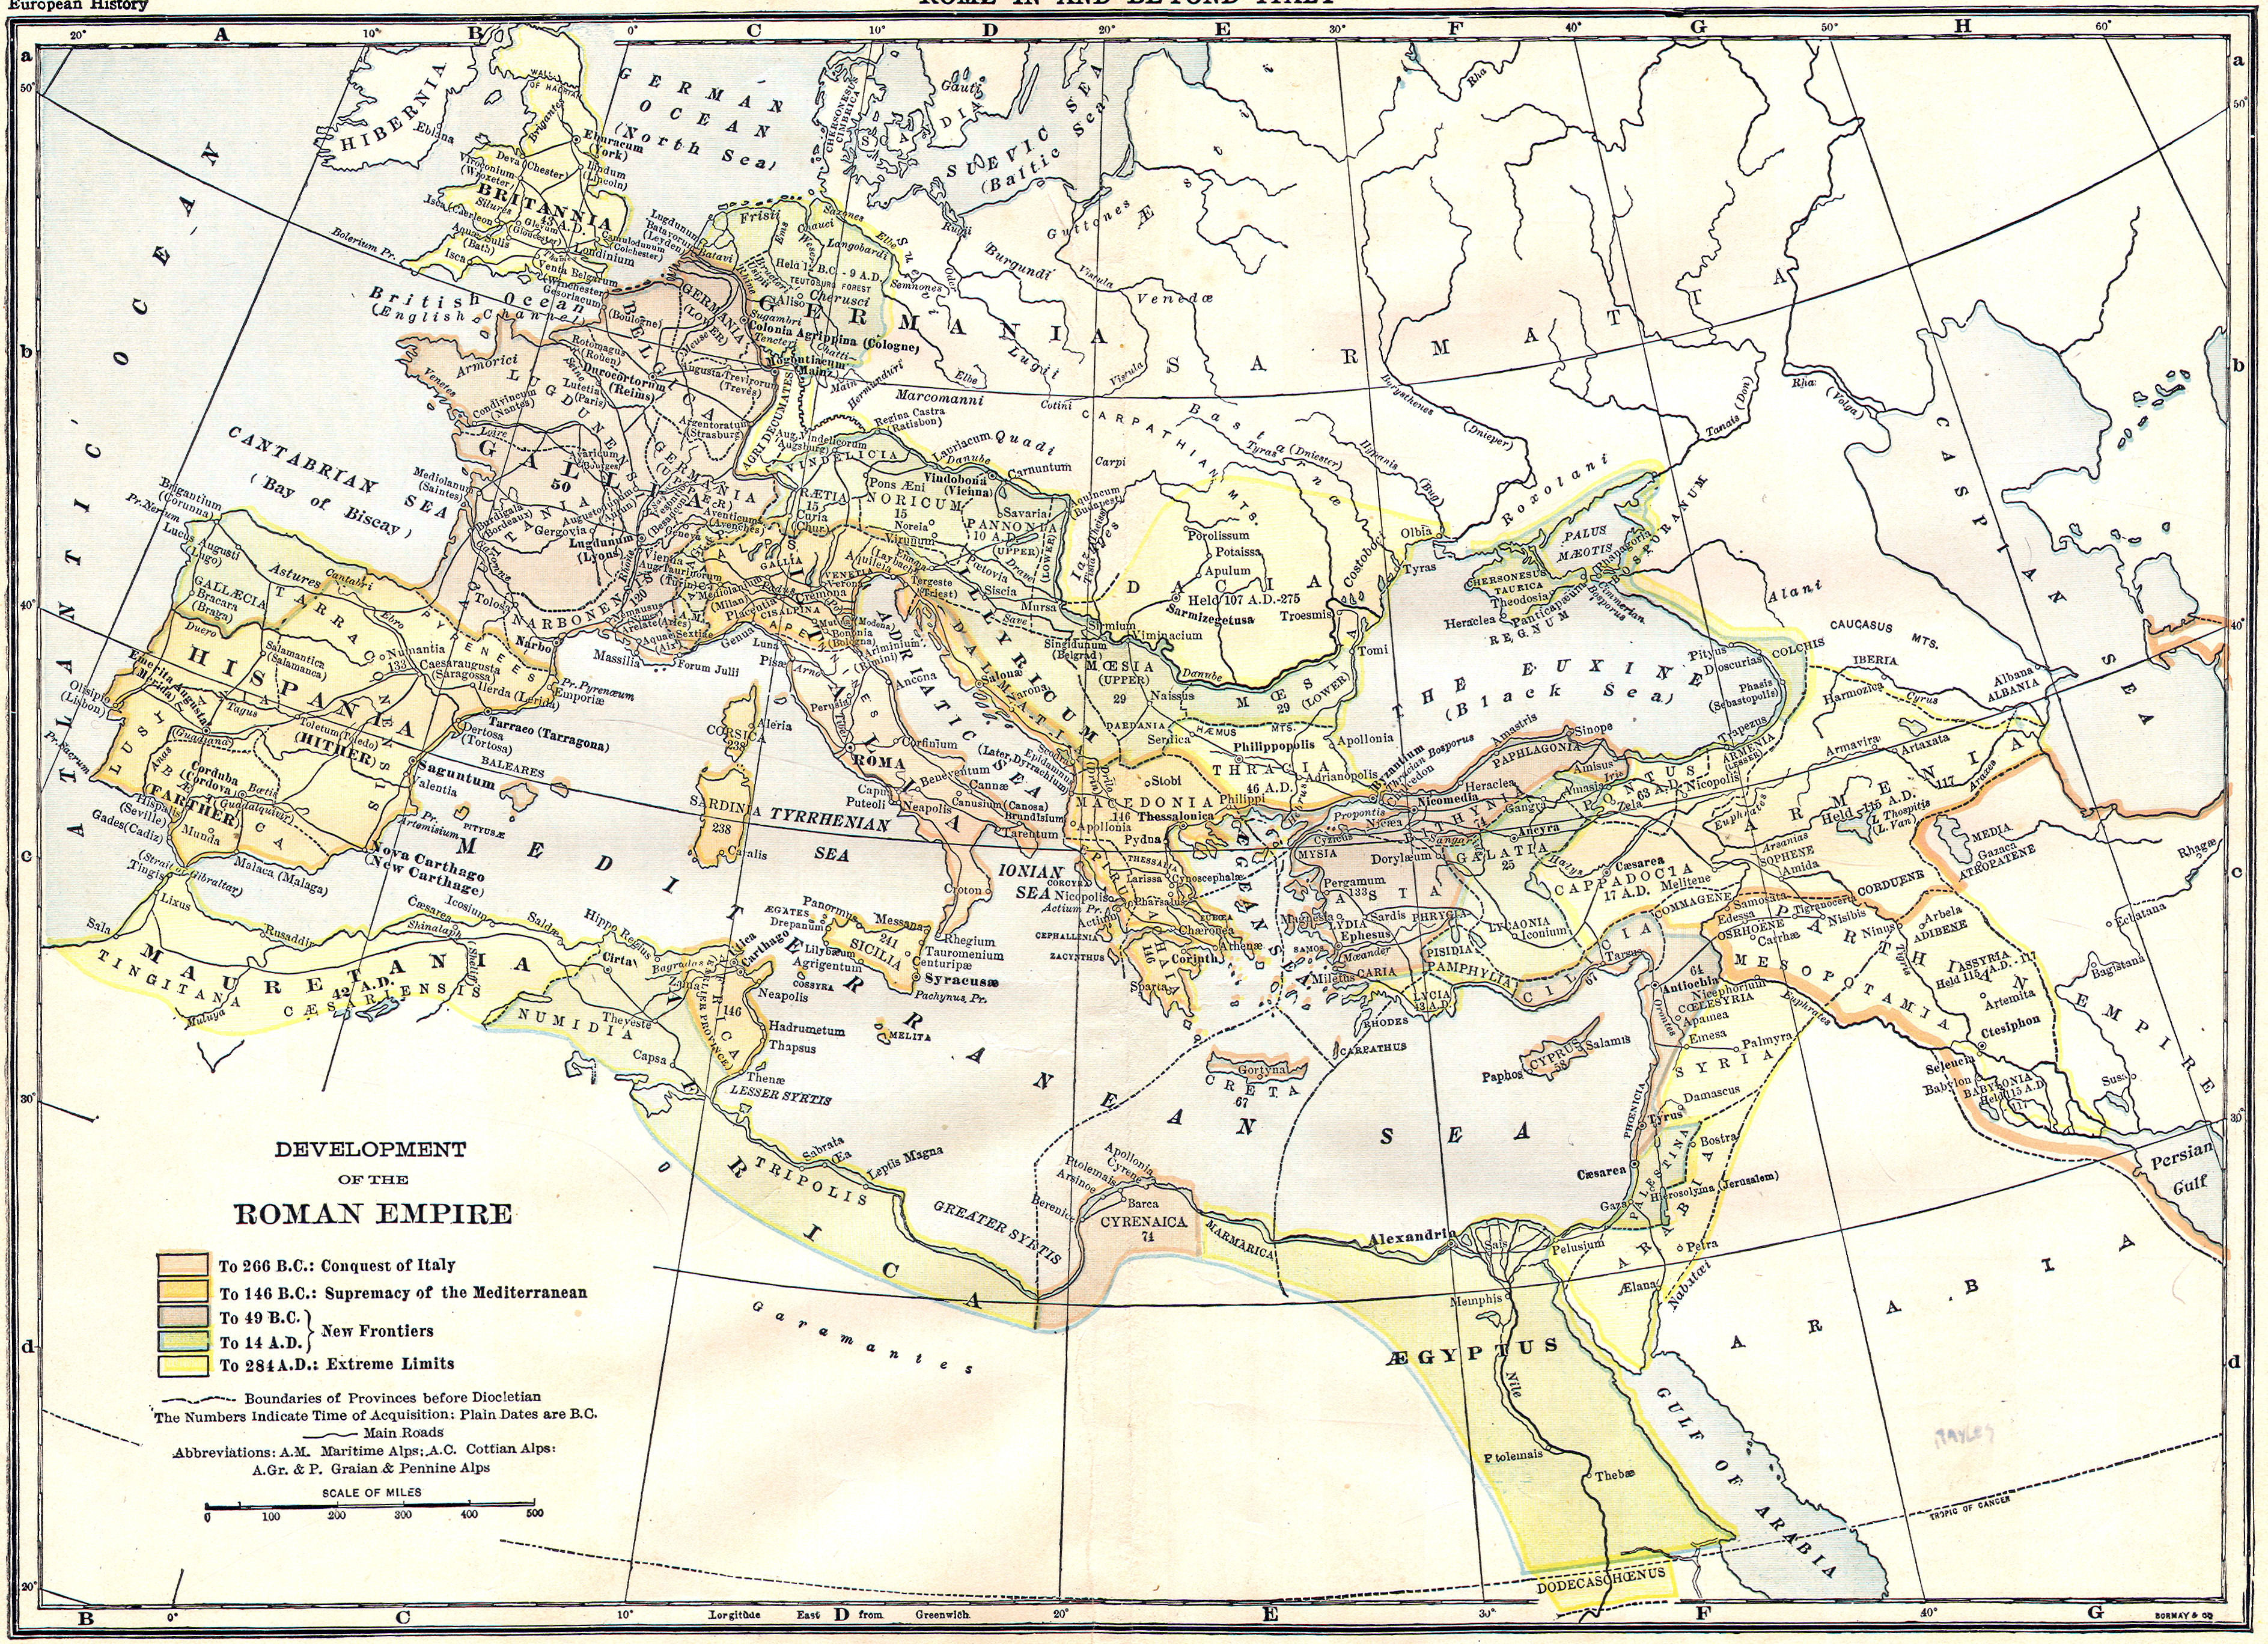
- Map No. 49. Map of Roman Empire at the period of its greatest extent
- Historical Europe Maps.
- Map of the Roman Empire
- Roman Empire at the Time of Christ.
- L'Empire Roman sous Theodose.
- Old Maps Online
- vici.org - Archaeological Atlas of Antiquity
- Historical Maps of Ancient Rome
- Maps of Ancient Rome
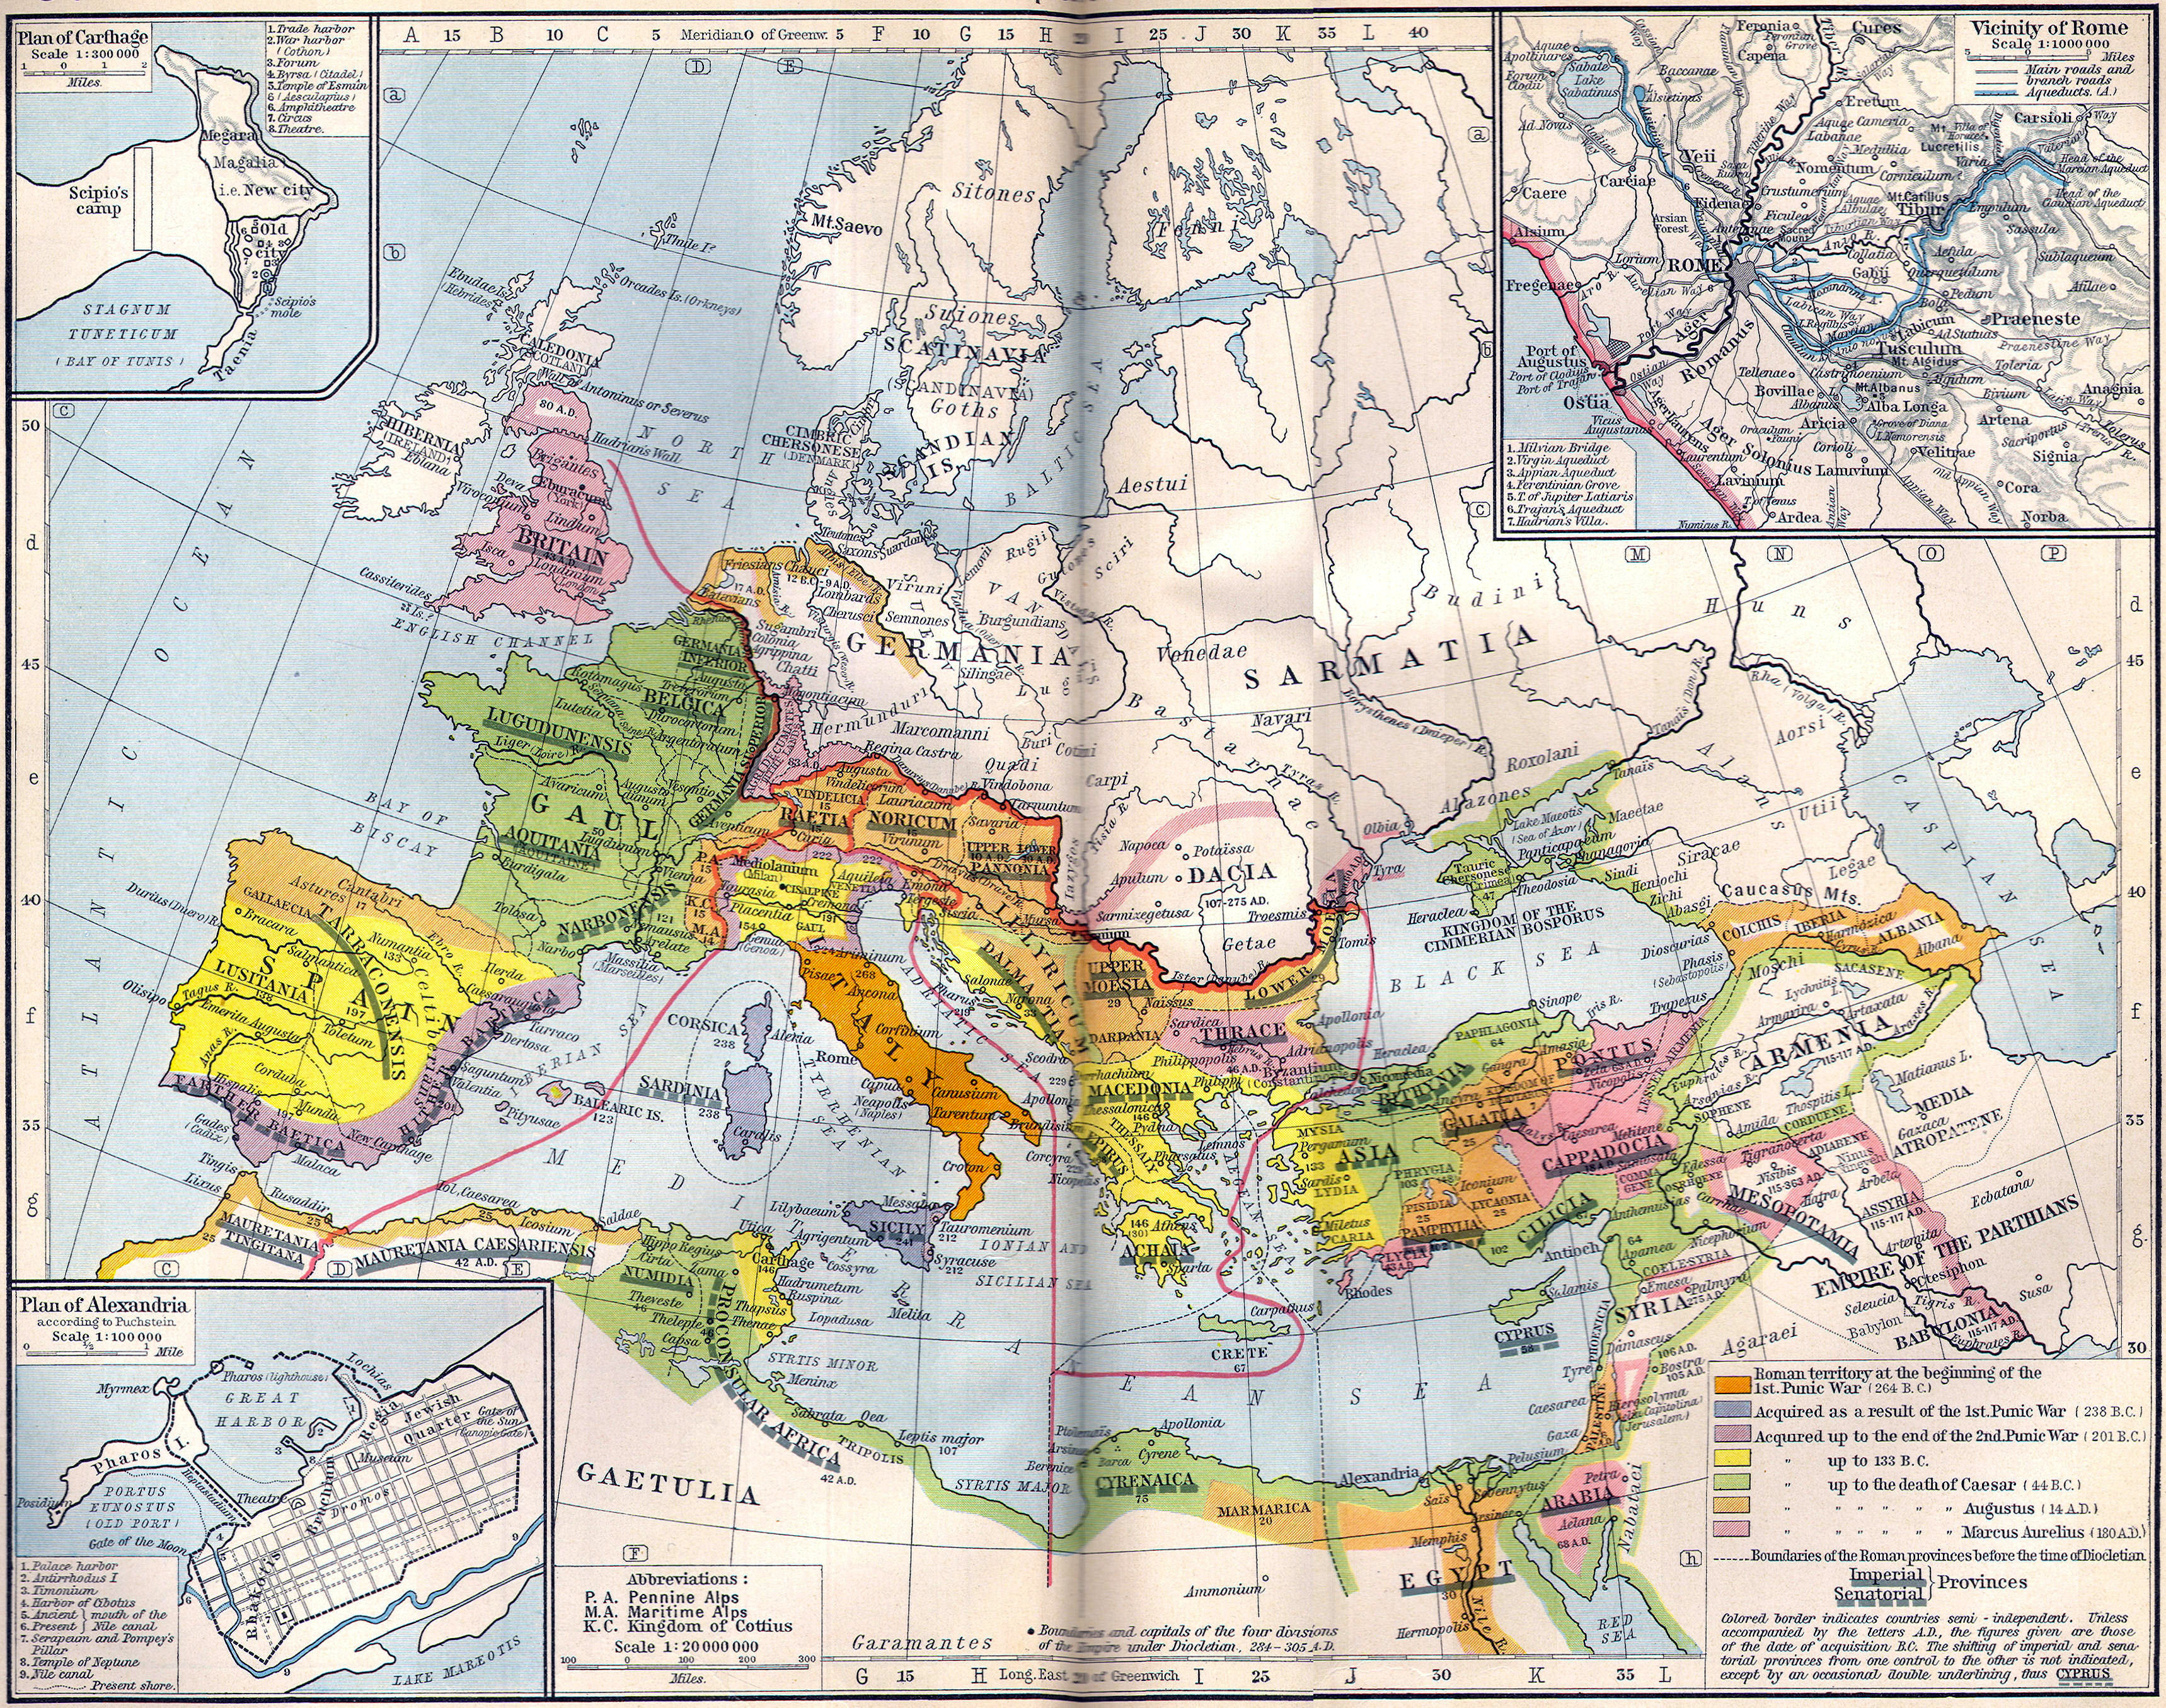
- Roman Empire at its greatest extent, A.D. 200
- Development of the Roman Empire, A.D. 180
- Territorial Expansion of Rome, A.D. 200
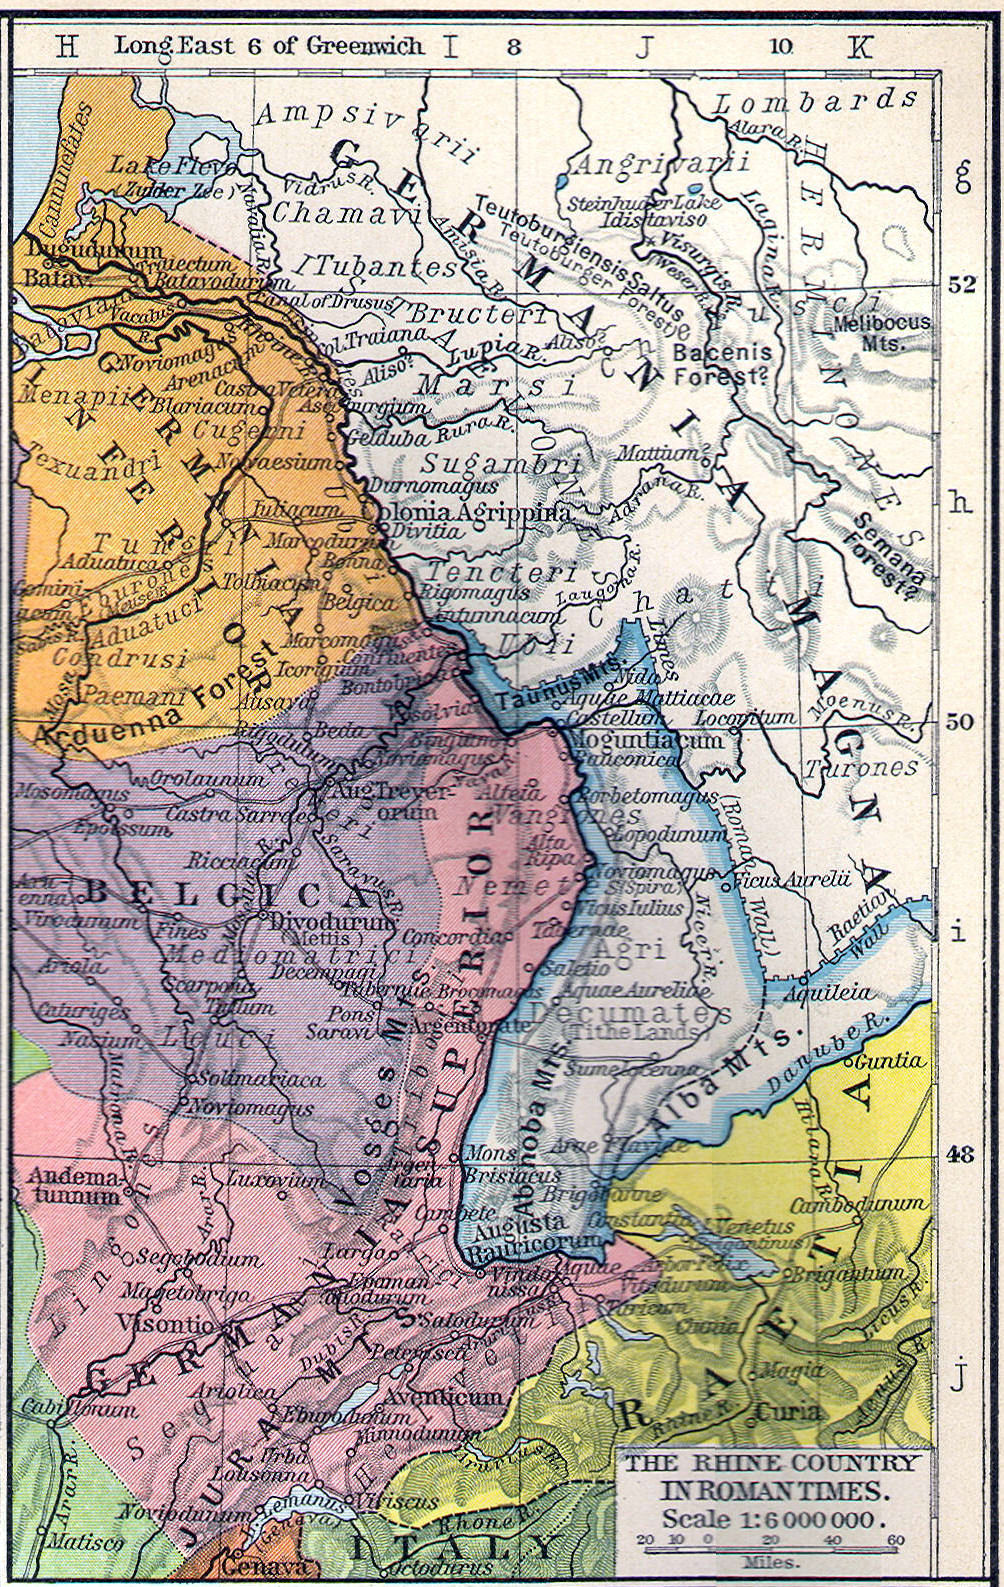
- The Rhine country in Roman times, A.D. 200
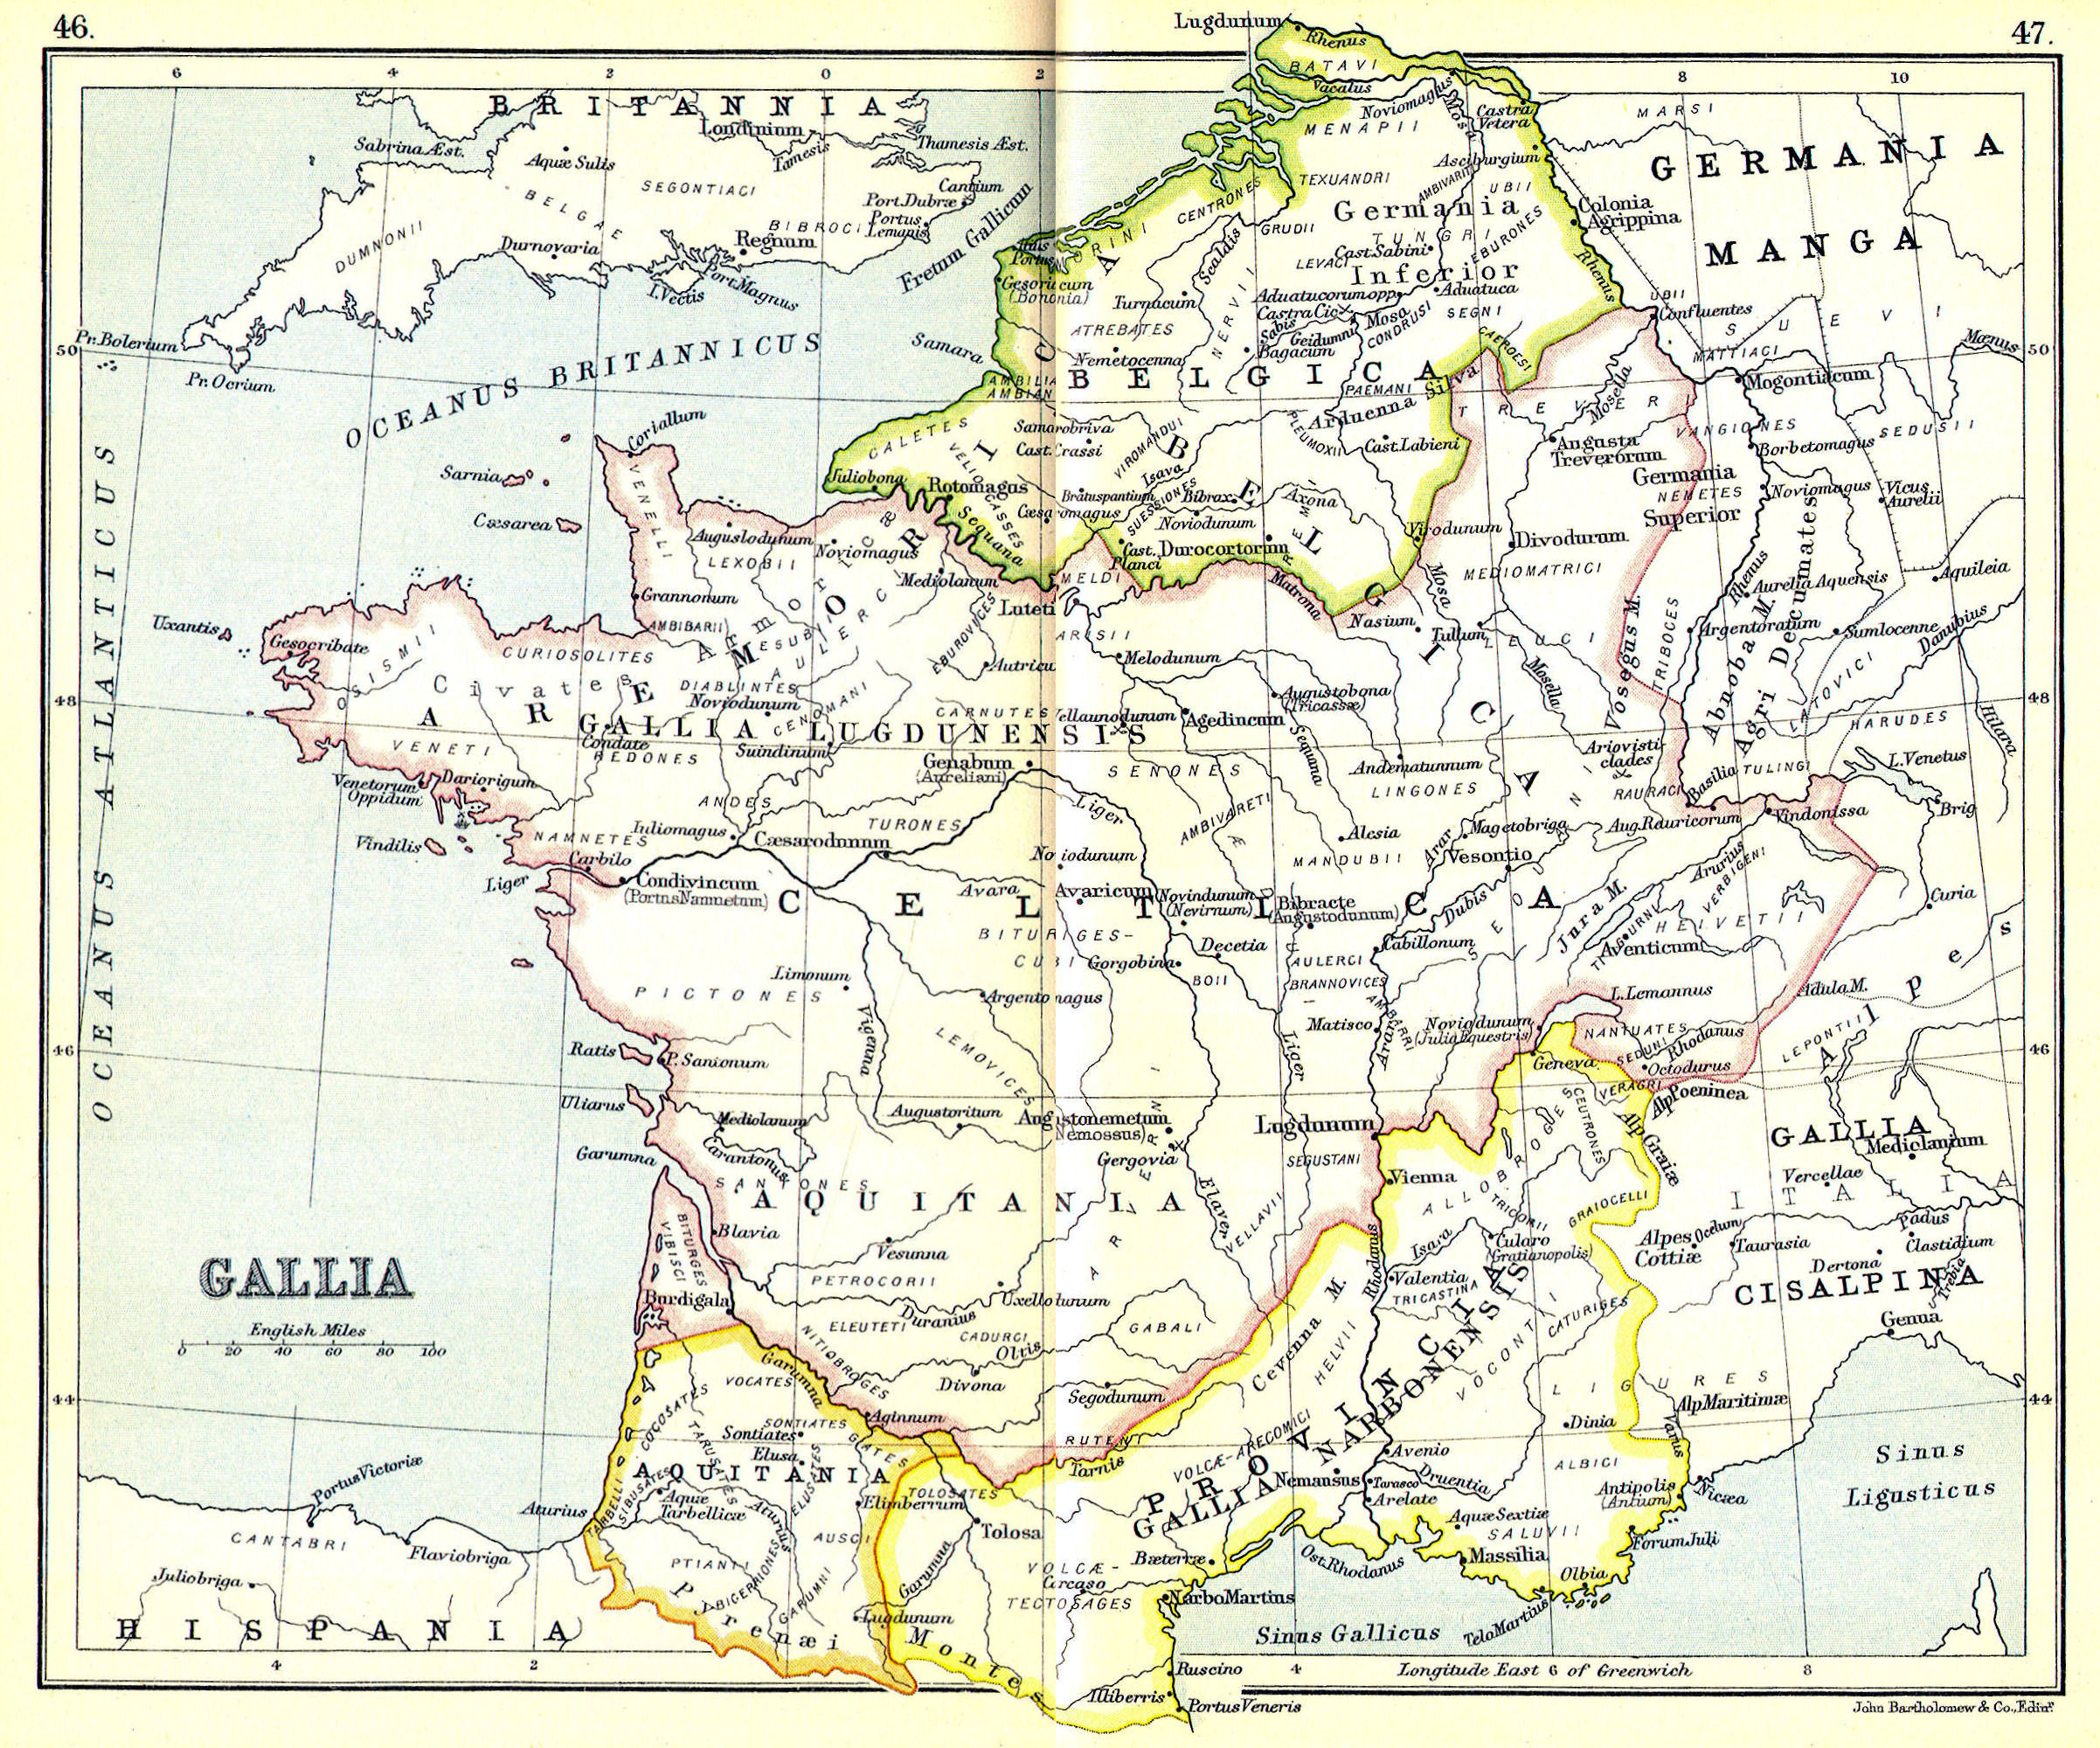
- Gallia, A.D. 200
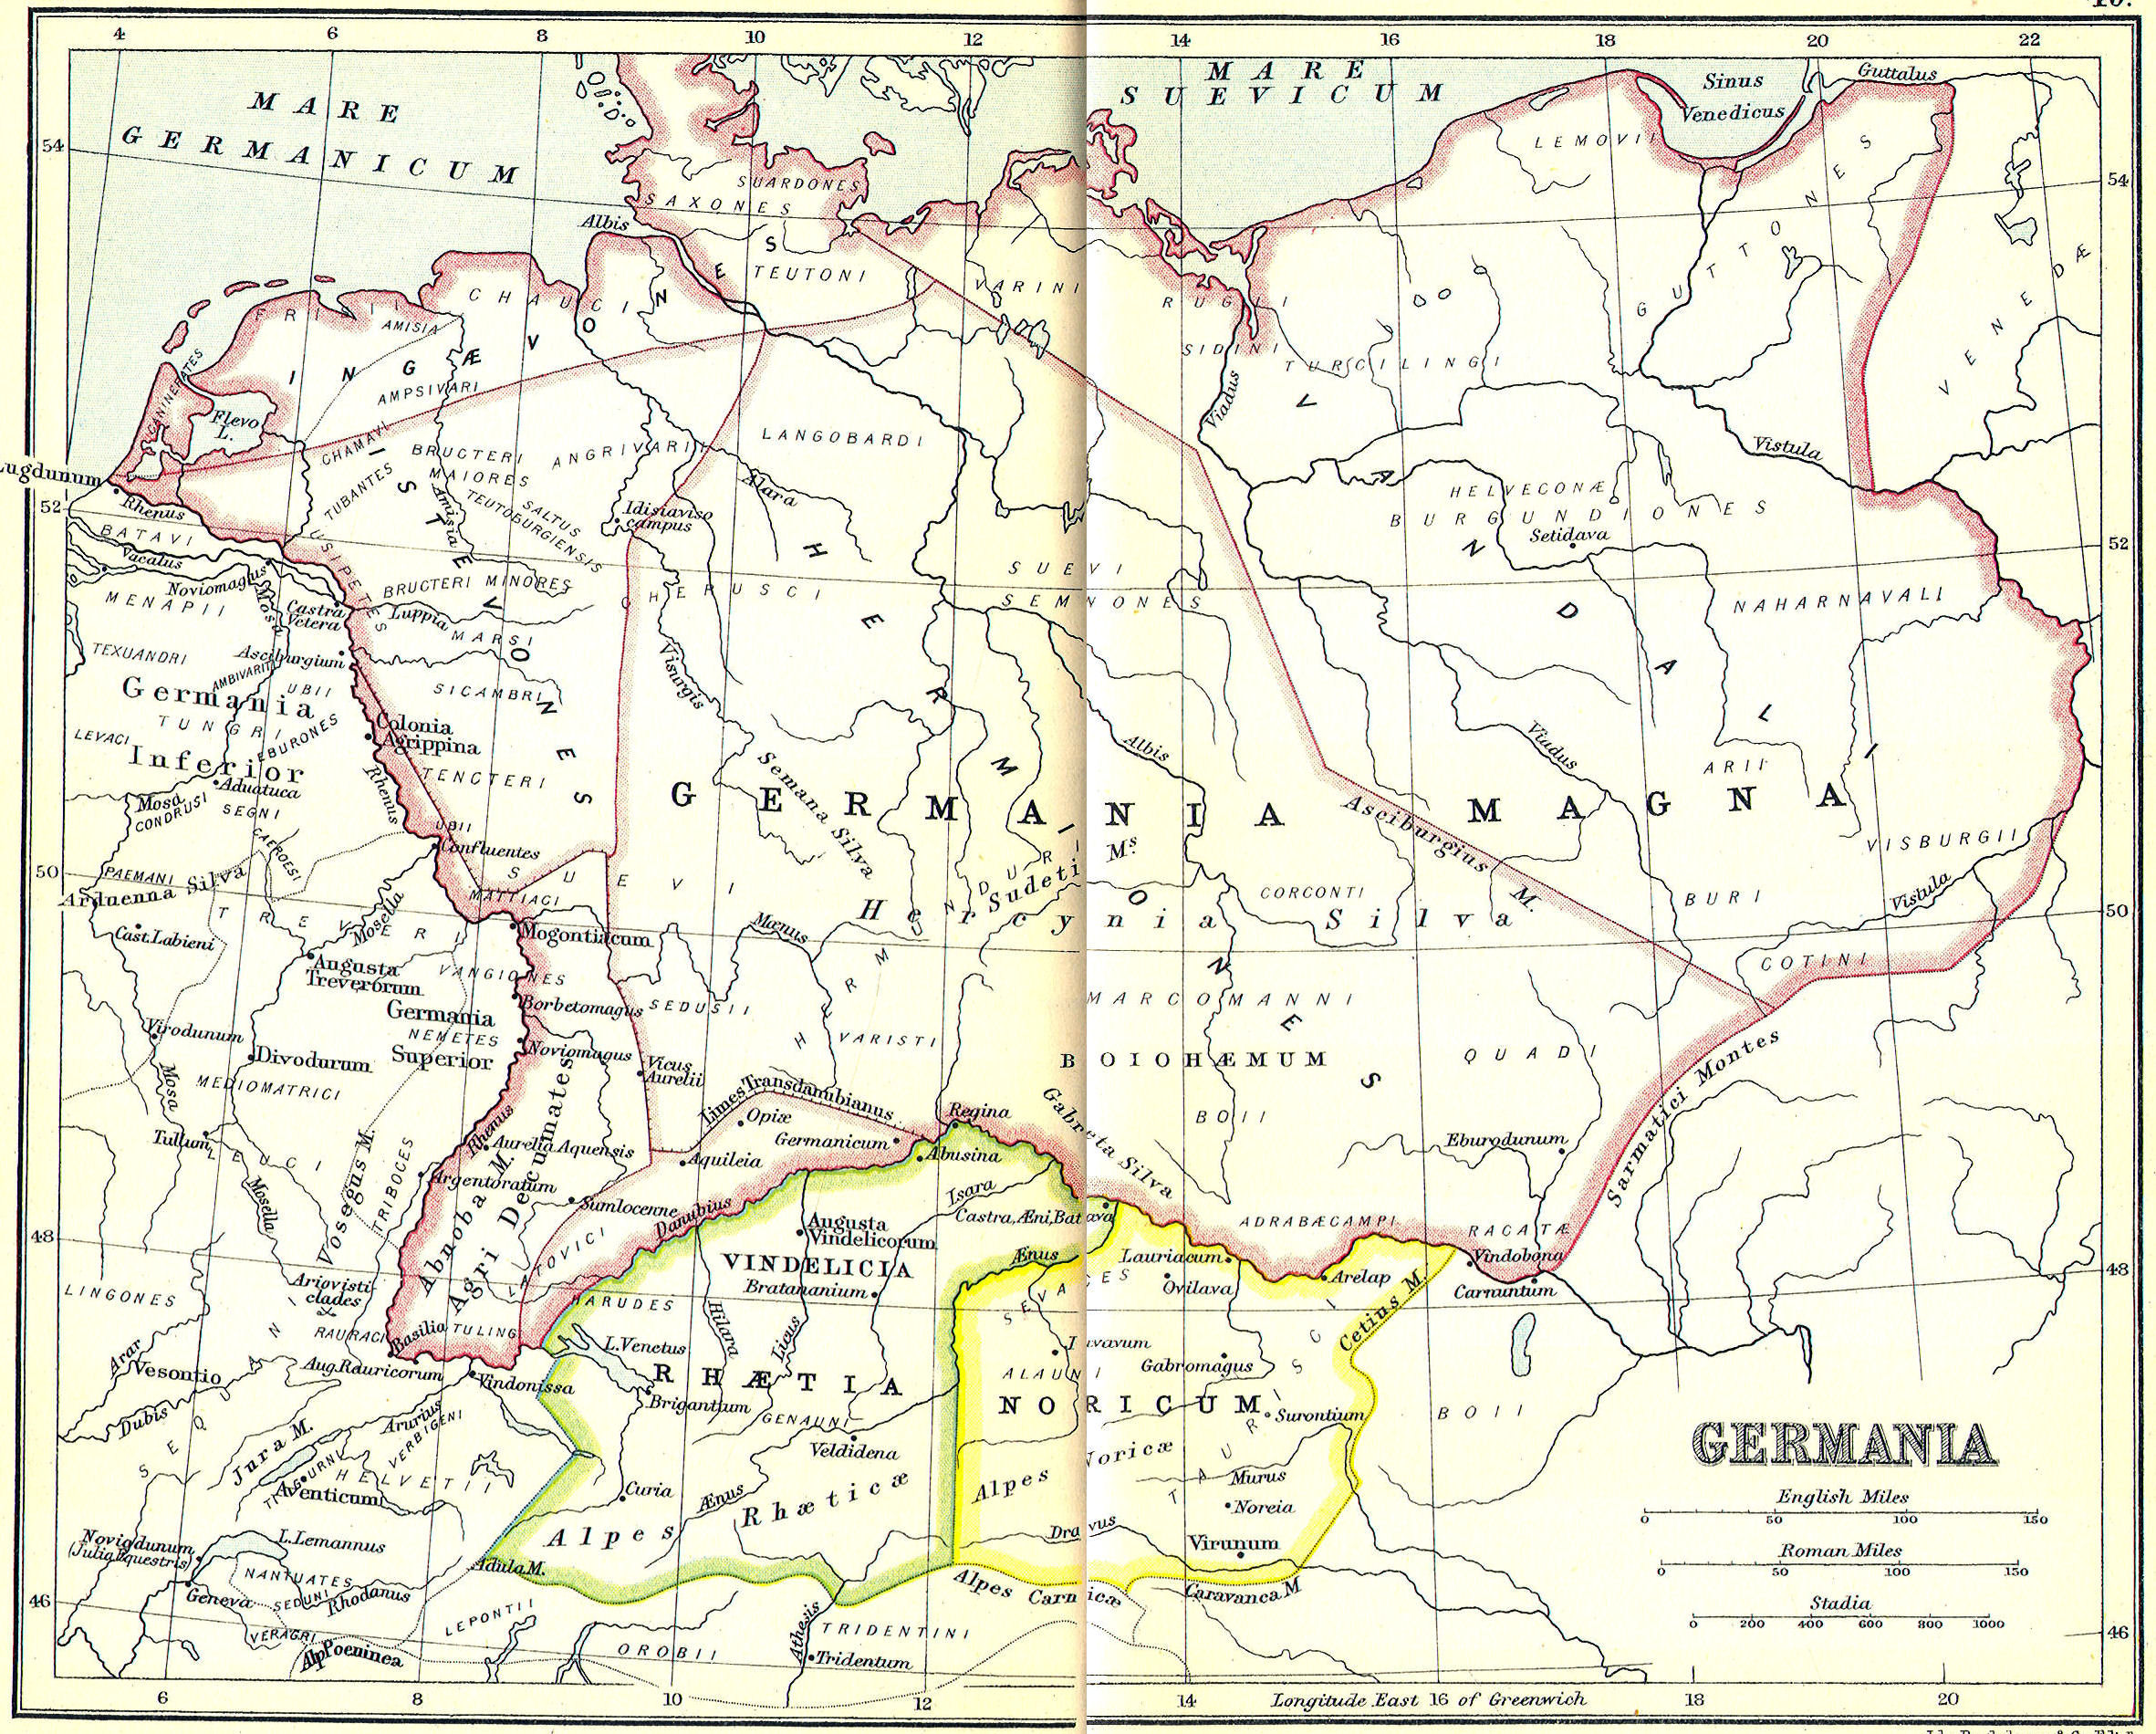
- Germania, A.D. 200
- Roman Empire on the eve of the Barbarian Irruptions, A.D. 400
- Reference Map of the European Provinces of the Roman Empire, A.D. 100
- Economic Map of the Ancient World, A.D. 200
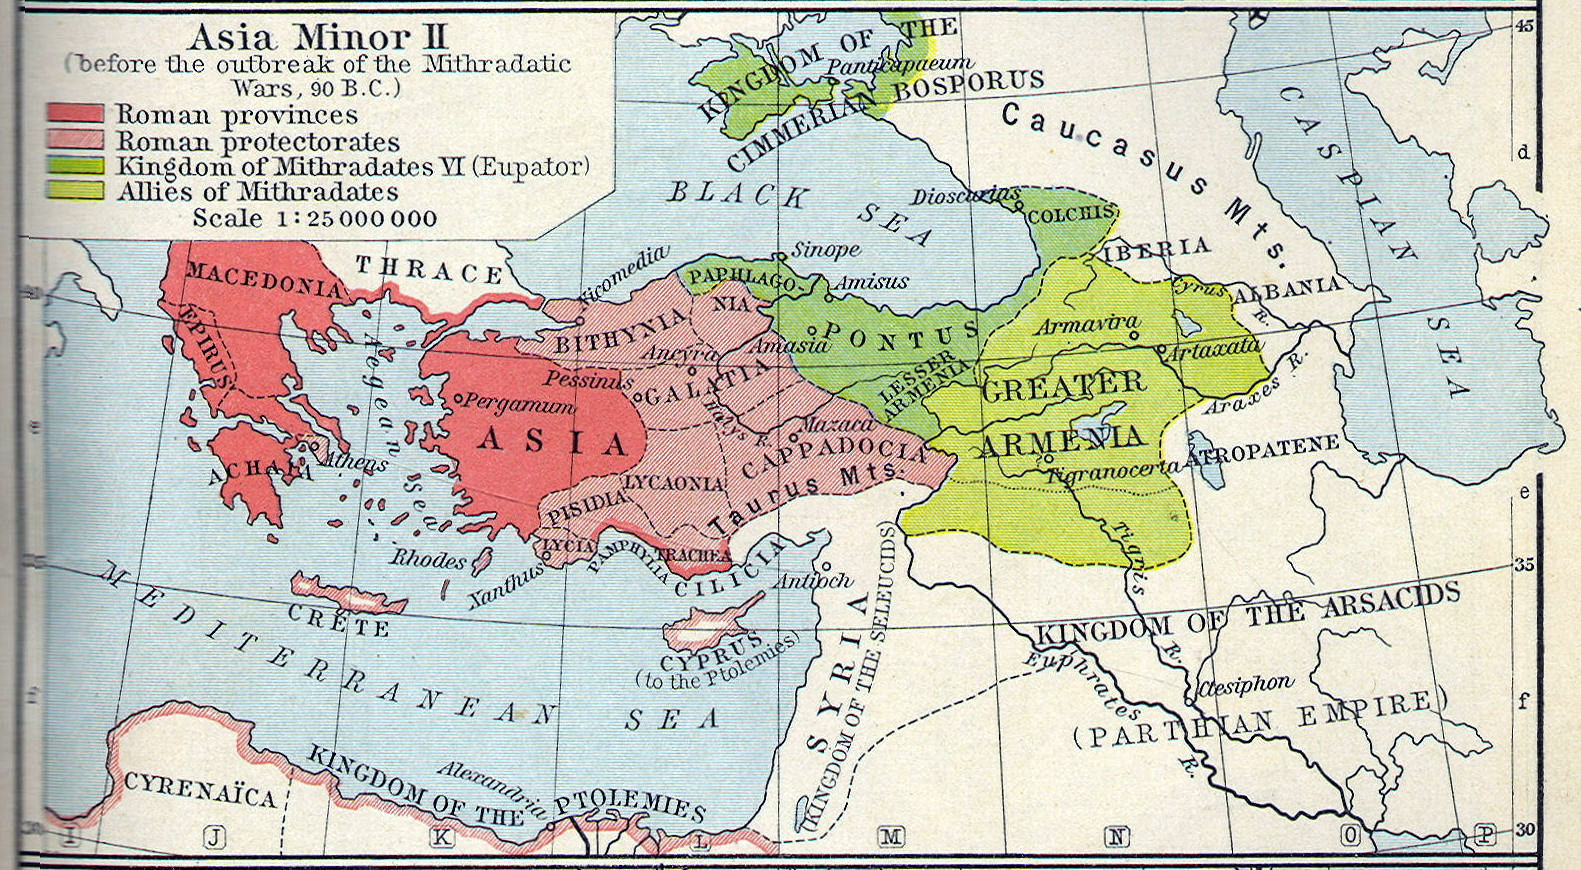
- Growth of Roman Power in Asia Minor, before the outbreak of the Mithridatic Wars, 90 B.C.
- The Growth of Roman Power in Italy to 218 B.C.
- Reference Map of Asia Minor under the Greeks and Romans, B.C. 100
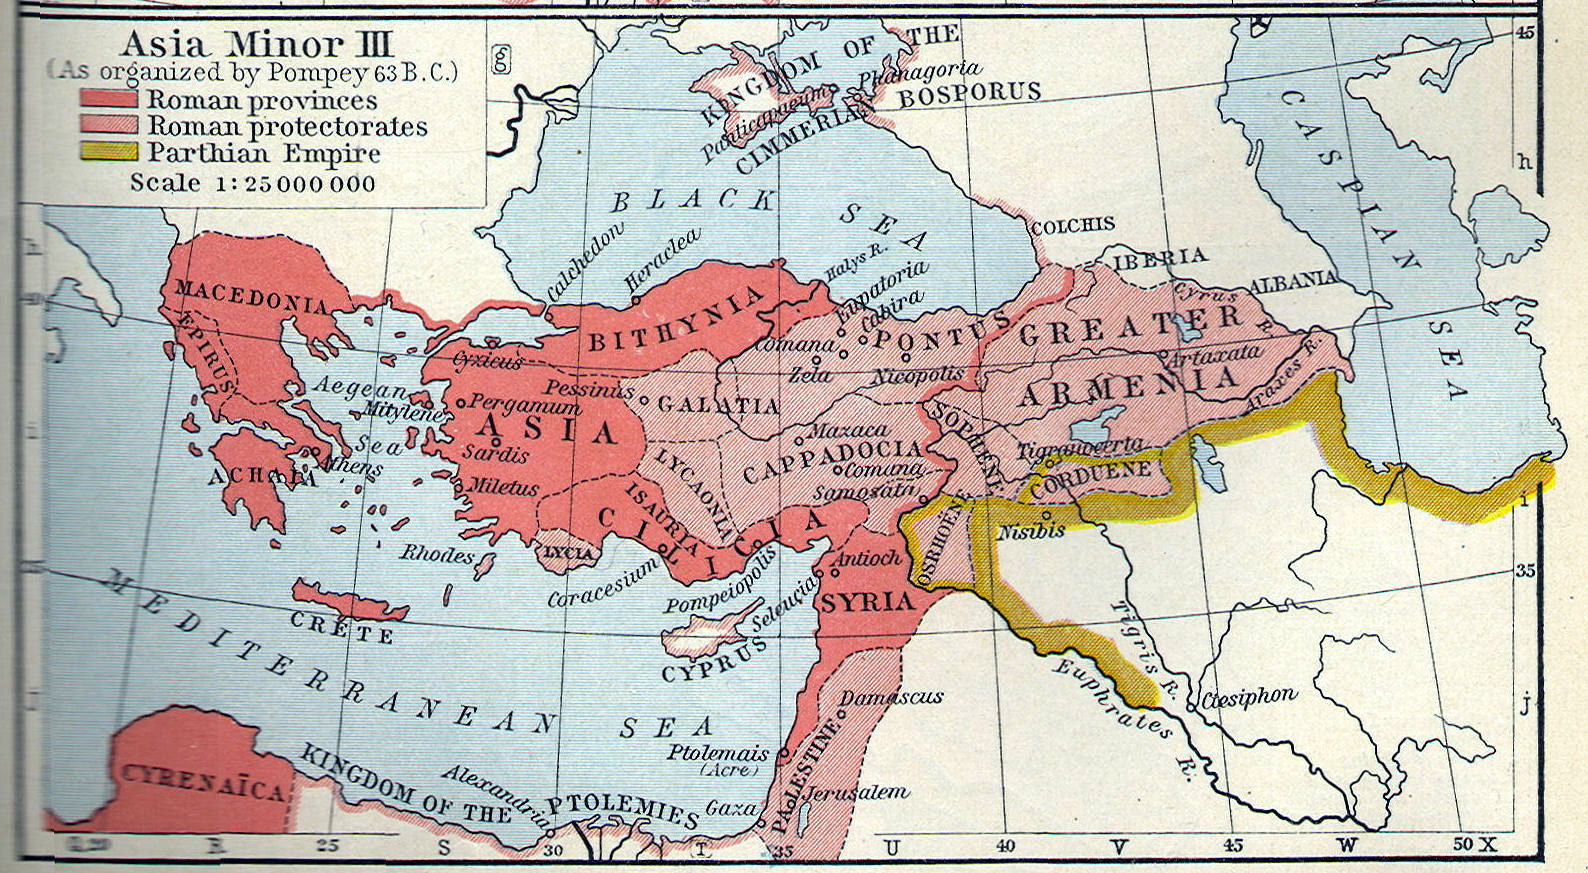
- Growth of Roman Power in Asia Minor, as organized by Pompey, 63 B.C.
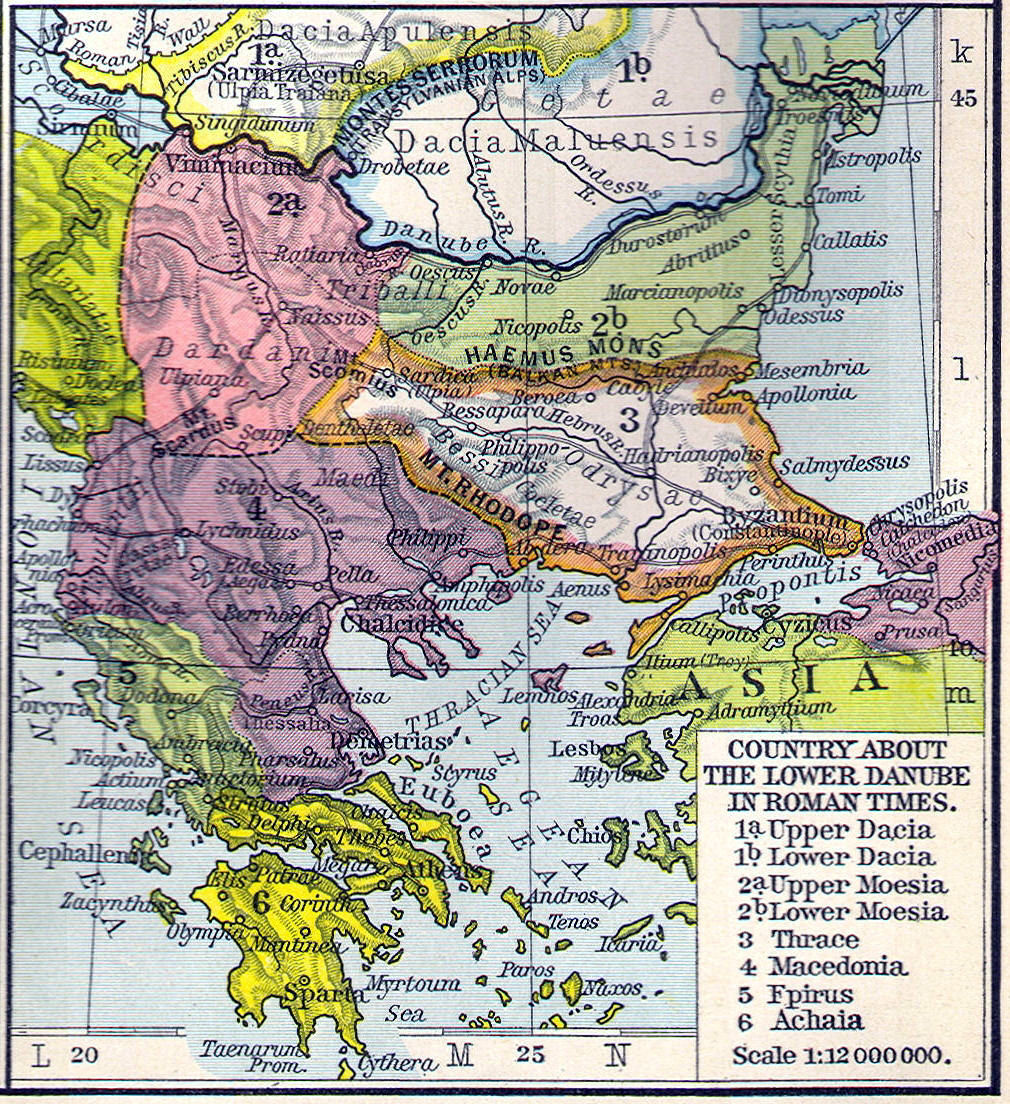
- Country about the lower Danube in Roman times, A.D. 200
- Growth of Roman Power in Asia Minor, as organized by Pompey, 63 B.C.
- Map of the Roman Empire under Hadrian (ruled 117–138 AD)
- The Roman Empire in A.D. 117 at its greatest extent, at the time of Trajan's death
- What Did Ancient Rome Look Like? (Cinematic Animation) - YouTube
- Tabula Peutingeriana" (Codex Vindobonensis 324) - The Tabula Peutingeriana is a copy of an old roadmap of ancient Roman road network called cursus publicus.
- How Did the Ancient Romans Manage to Build Perfectly Straight, Ultra Durable Roads? - YouTube
- Ancient Rome's Road System: The Rise and Fall of Rome - YouTube
- Were Roman Roads more Durable than Modern Highways? - YouTube
- Did the Roman Empire Invade Ireland?
- Roman Roads - Wikipedia
- Milliarium of Aiton Milliarium of Aiton is an ancient Roman milestone (milliarium) near Cluj-Napoca, Romania, and dates to A.D. 108. Roman Millarium provided metadata long before providing metadata was cool.
- Attribution for some icons: