Are there any examples to avoid label overlap in pie chart? #149
Labels
Comments
Annotate pie charts with ggrepelKamil Slowikowski Let’s make some data: library(ggplot2)
df <- data.frame(
group = c("Antelope", "Bird", "Cat", "Dog", "Eel"),
value = c(25, 25, 50, 1, 1)
)
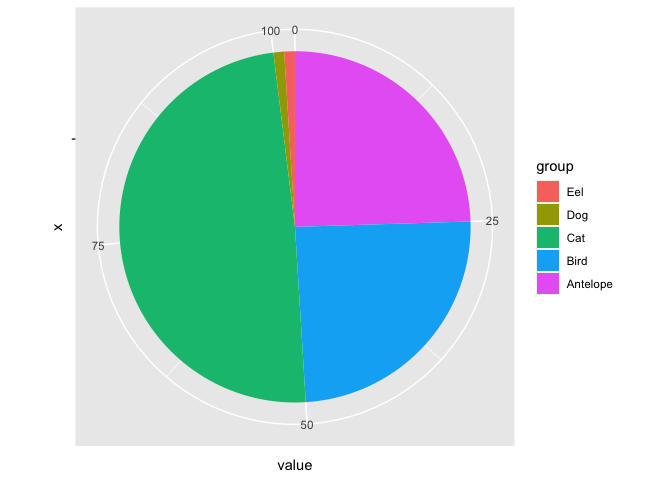
dfdf$group <- factor(df$group, levels = rev(levels(df$group)))Make a pie chart: ggplot(df, aes(x = "", y = value, fill = group)) +
geom_bar(width = 1, stat = "identity") +
coord_polar("y")
Add labels with library(ggrepel)
window <- function(x) {
n <- length(x)
res <- vector(length = n - 1)
for (i in seq(n - 1)) {
res[i] <- (x[i] + x[i+1]) / 2
}
return(res)
}
df$pos <- window(cumsum(c(0, df$value)))
ggplot(df, aes(x = "", y = value, fill = group))+
geom_bar(width = 1, stat = "identity") +
coord_polar("y", start = 0) +
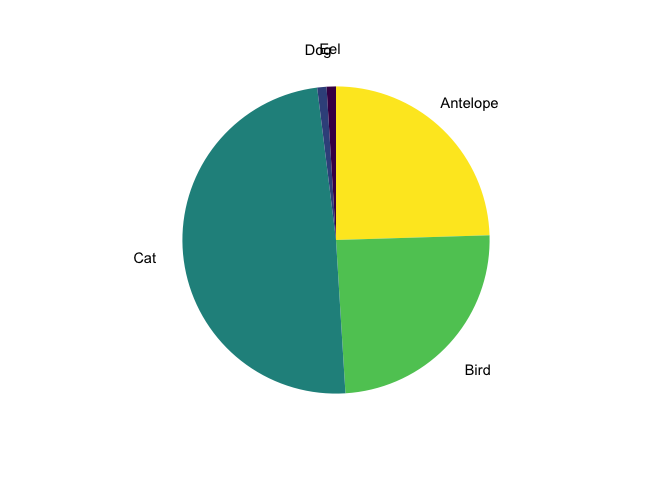
geom_text(aes(y = pos, x = 1.75, label = group)) +
guides(fill = FALSE) +
scale_fill_viridis_d() +
theme_void()
Or use library(ggrepel)
window <- function(x) {
n <- length(x)
res <- vector(length = n - 1)
for (i in seq(n - 1)) {
res[i] <- (x[i] + x[i+1]) / 2
}
return(res)
}
df$pos <- window(cumsum(c(0, df$value)))
ggplot(df, aes(x = "", y = value, fill = group))+
geom_bar(width = 1, stat = "identity") +
coord_polar("y", start = 0) +
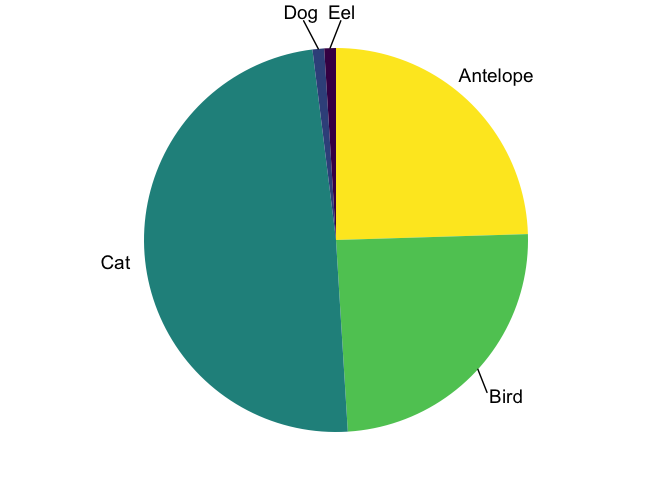
geom_text_repel(
aes(y = pos, x = 1.5, label = group),
size = 5, nudge_x = 0.2, min.segment.length = 1.25
) +
guides(fill = FALSE) +
scale_fill_viridis_d() +
theme_void()
sessionInfo() |
|
It is really cool! |
|
Is there a trick to do better with longer labels, to ensure they don't go inside the pie chart? library(ggplot2)
df <- data.frame(
group = c("Antelope", "Bird", "Cat a longer label", "Dog", "Eel a longer label"),
value = c(25, 25, 50, 1, 1)
)
df
#> group value
#> 1 Antelope 25
#> 2 Bird 25
#> 3 Cat a longer label 50
#> 4 Dog 1
#> 5 Eel a longer label 1
df$group <- factor(df$group, levels = rev(df$group))
library(ggrepel)
window <- function(x) {
n <- length(x)
res <- vector(length = n - 1)
for (i in seq(n - 1)) {
res[i] <- (x[i] + x[i+1]) / 2
}
return(res)
}
df$pos <- window(cumsum(c(0, df$value)))
ggplot(df, aes(x = "", y = value, fill = group))+
geom_bar(width = 1, stat = "identity") +
coord_polar("y", start = 0) +
geom_text_repel(
aes(y = pos, x = 1.5, label = group),
size = 5, nudge_x = 0.2, min.segment.length = 1.25
) +
guides(fill = "none") +
scale_fill_viridis_d() +
theme_void()Created on 2024-04-30 with reprex v2.1.0 |

Sign up for free
to join this conversation on GitHub.
Already have an account?
Sign in to comment
I have a problem with labeling percent in pie charts. Some labels are overlapped since the space is not enough to distinctively show them.
The text was updated successfully, but these errors were encountered: