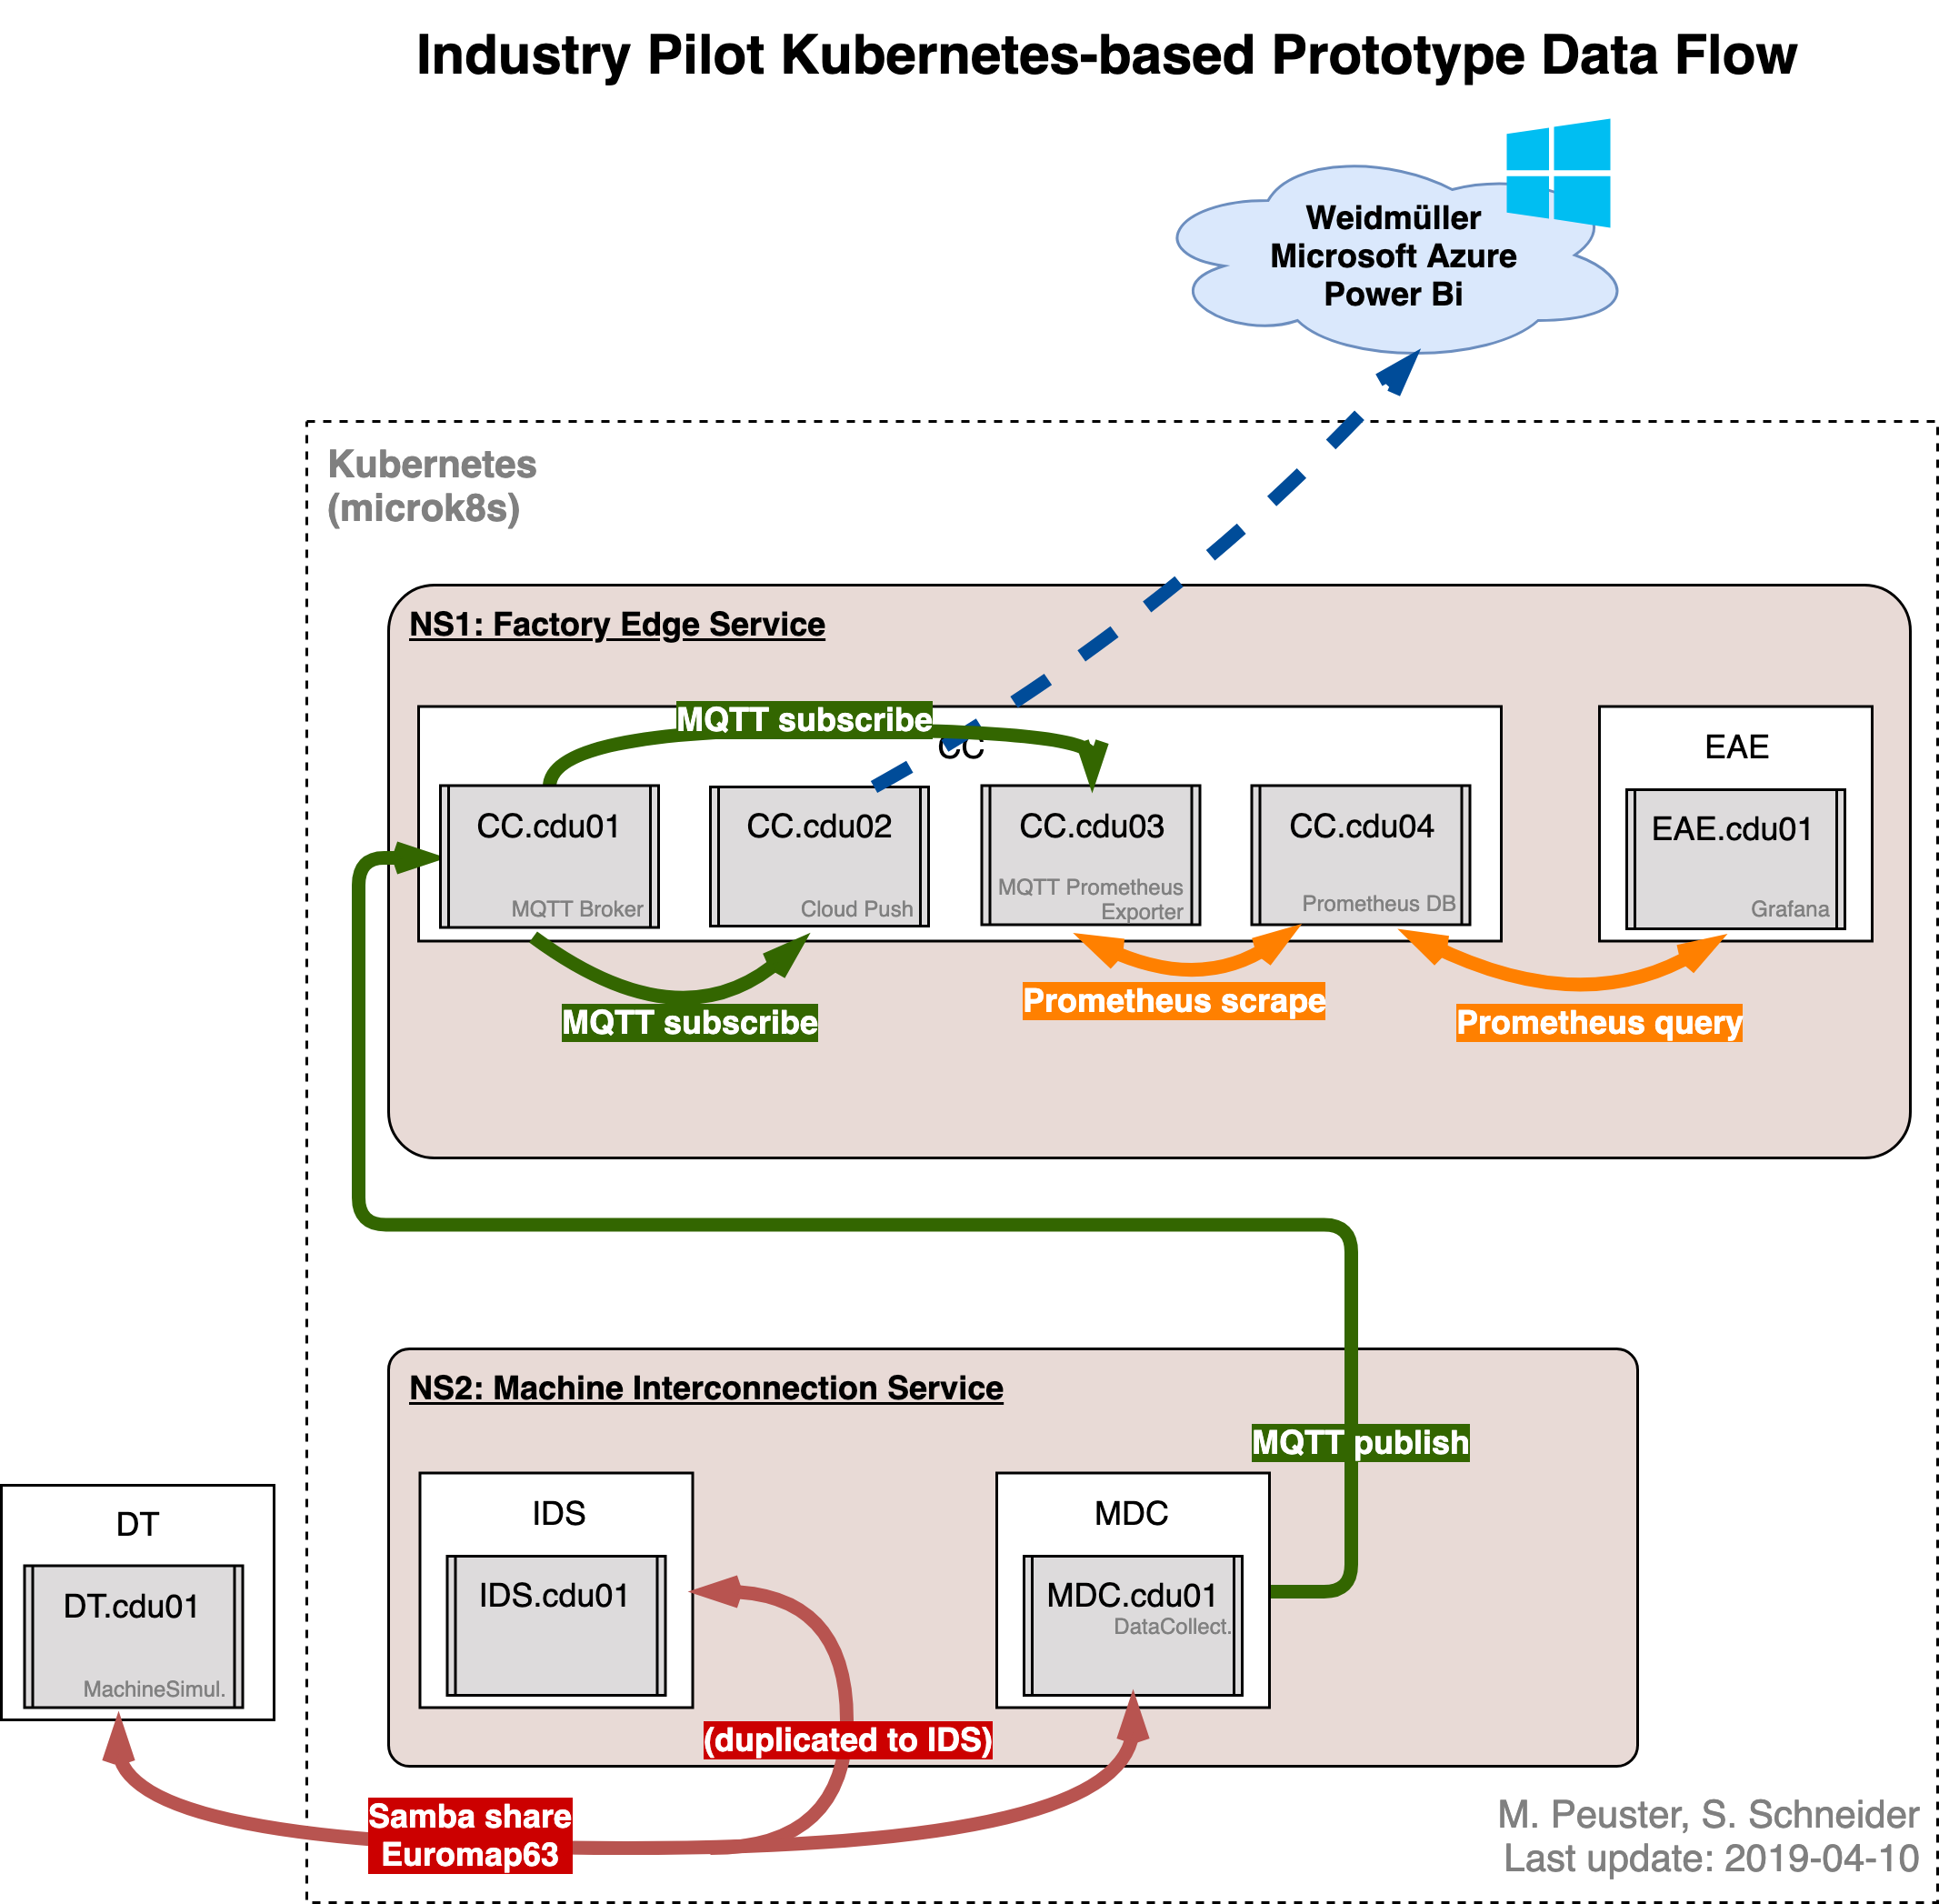
Deploying the service on Kubernetes
Related issues:
Related artifacts:
- microk8s setup guide
- Kubernetes resource descriptors
- CNF containers with
:k8stag (see VNFs directory)
Related wiki pages:
Tested on Ubuntu 18.04
Since the digital twin (DT) is running outside the Kubernetes deployment, it is the only Docker image that needs to be build locally. All other VNFs, which will be deployed inside Kubernetes, are pulled directly from Docker Hub (using the k8s tag).
To build the DT, run the following within the vnfs directory:
./build_dt_k8s.shSee guide here. In short:
# install snapd
sudo apt install snapd
# install microk8s
sudo snap install microk8s --classic
# you might need to add '/snap/bin' to your path (restart terminal afterwards)
echo 'PATH="$PATH:/snap/bin"' >> .profile
# create alias/shortcut
sudo snap alias microk8s.kubectl kubectl
# start/stop with sudo mikrok8s.start/.stop
Enable DNS and check that it's running:
$microk8s.enable dns dashboard

$kubectl cluster-info
Kubernetes master is running at http://127.0.0.1:8080
Heapster is running at http://127.0.0.1:8080/api/v1/namespaces/kube-system/services/heapster/proxy
KubeDNS is running at http://127.0.0.1:8080/api/v1/namespaces/kube-system/services/kube-dns:dns/proxy
Grafana is running at http://127.0.0.1:8080/api/v1/namespaces/kube-system/services/monitoring-grafana/proxy
InfluxDB is running at http://127.0.0.1:8080/api/v1/namespaces/kube-system/services/monitoring-influxdb:http/proxymicrok8s.start
# check status
microk8s.statusMetalLB is required for providing the LoadBalancer service of the EAE and the MDC, which need to be accessed externally.
Install MetalLB:
# install
$ kubectl apply -f https://raw.githubusercontent.com/google/metallb/v0.8.3/manifests/metallb.yaml
# check installation
$ kubectl get all --all-namespaces
Check your machine's Ethernet address (here 10.1.1.1):
$ ifconfig
cbr0: flags=4419<UP,BROADCAST,RUNNING,PROMISC,MULTICAST>  mtu 1500
        inet 10.1.1.1  netmask 255.255.255.0  broadcast 0.0.0.0
        inet6 fe80::c89f:f1ff:fe70:cfd3  prefixlen 64  scopeid 0x20<link>
        ether ca:9f:f1:70:cf:d3  txqueuelen 1000  (Ethernet)
        RX packets 3969  bytes 1597839 (1.5 MB)
        RX errors 0  dropped 0  overruns 0  frame 0
        TX packets 4108  bytes 3462749 (3.4 MB)
        TX errors 0  dropped 0 overruns 0  carrier 0  collisions 0
and adjust the corresponding address range of the LB in k8s/metallb-conf.yml accordingly if necessary (currently set to 10.1.1.1-10.1.1.21). Apply the configuration:
$ cd tng-industrial-pilot/k8s
$ kubectl apply -f metallb-conf.yml
configmap/config createdAt the start, microk8s should be running but with nothing insde:
$ microk8s.status
microk8s is running
...

$ kubectl get pods
No resources found.
$ kubectl get services
NAME         TYPE        CLUSTER-IP     EXTERNAL-IP   PORT(S)   AGE
kubernetes   ClusterIP   10.152.183.1   <none>        443/TCP   2d23h

$ docker ps
CONTAINER ID IMAGE COMMAND CREATED STATUS PORTS NAMESTo simplify starting all containers of both network services, we use the Kubernetes descriptors. By applying the apply command to the whole ns1 and ns2 directory, respectively. This will trigger Kubernetes to create the deployments and services described in the .yml files (one per CDU).
# from project root
$ cd k8s
$ kubectl apply -f ns1
service/ns1-cc-service created
deployment.apps/ns1-cc-deployment created
service/ns1-eae-service created
deployment.apps/ns1-eae-deployment created
$ kubectl apply -f ns2
service/ns2-mdc-service created
deployment.apps/ns2-mdc-deployment created
You can check that all pods with the containers inside and all services are started:
$ kubectl get pods
NAME                                  READY   STATUS    RESTARTS   AGE
ns1-cc-deployment-6cc8d5bf5f-6n6q4    4/4     Running   0          13s
ns1-eae-deployment-8564dc4946-kpw67   1/1     Running   0          13s
ns2-mdc-deployment-c4d5db55c-zjgpv    1/1     Running   0          5s

$ kubectl get services
NAME              TYPE           CLUSTER-IP       EXTERNAL-IP   PORT(S)                         AGE
kubernetes        ClusterIP      10.152.183.1     <none>        443/TCP                         2d23h
ns1-cc-service    LoadBalancer   10.152.183.136   10.1.1.1      1883:30112/TCP,9090:30184/TCP   96s
ns1-eae-service   LoadBalancer   10.152.183.163   10.1.1.2      3000:30912/TCP                  96s
ns2-mdc-service   LoadBalancer   10.152.183.164   10.1.1.3      139:30790/TCP,445:32638/TCP     88s
# external IP of LB services assigned correctly by MetalLBThe easiest way to access the EAE is through its LB service.
# get the external IP of the LB service
$ kubectl get svc -l cnf=eae
NAME              TYPE           CLUSTER-IP      EXTERNAL-IP   PORT(S)          AGE
ns1-eae-service   LoadBalancer   10.152.183.22   10.1.1.1      3000:30963/TCP   6m59s

# the EAE can be accessed at external IP with the original port number (targetPort)
$ curl 10.1.1.1:3000
<a href="/login">Found</a>.Instead of using the LB's external IP, the EAE can also be accessed through the cluster's node IP directly. This is useful for accessing from a remote host.
-
Usually: Just use the IP/DNS name of the node/machine.
Within the same node get the cluster IP:
$ kubectl cluster-info
Kubernetes master is running at https://192.168.99.100:8443
KubeDNS is running at https://192.168.99.100:8443/api/v1/namespaces/kube-system/services/kube-dns:dns/proxy
Here, the IP is 192.168.99.100
-
Get the service's
nodePort:$ kubectl get svc -l cnf=eae NAME TYPE CLUSTER-IP EXTERNAL-IP PORT(S) AGE ns1-eae-service LoadBalancer 10.152.183.22 10.1.1.1 3000:30963/TCP 6m59s
Here, the EAE's port 3000 (inside the cluster and through the LB) is mapped to the node's port 30963 for external access.
-
Access the EAE's dashboard under
<cluster-ip>:<port>. In this case,192.168.99.100:30963. Grafana's default login is: admin, admin
Attention: Using https:// will not work.
The digital twin runs, similar to a real manufacturing machine, outside the Kubernetes deployment. Here, it's deployed as an individual Docker container. It connects to the MDC's Samba file share, which is exposed via a LoadBalancer service:
$ kubectl get svc -l cnf=mdc
NAME              TYPE           CLUSTER-IP       EXTERNAL-IP   PORT(S)                       AGE
ns2-mdc-service   LoadBalancer   10.152.183.192   10.1.1.3      139:31334/TCP,445:30372/TCP   18m
Here, the external IP is 10.1.1.3. This has to be passed to the DT via its variable DT_EM63_SHARE_HOST when starting it (in new terminal):
docker run -d --rm --privileged -p 15001:15001 -e DT_EM63_SHARE_HOST='10.1.1.3' --name vnf-dt sonatanfv/vnf-dt:k8sTo check that it's working, check the logs of the MDC:
$ kubectl get pods -l cnf=mdc
NAME                                 READY   STATUS    RESTARTS   AGE
ns2-mdc-deployment-5544c6589-59kml   1/1     Running   0          22m

$ kubectl logs -f ns2-mdc-deployment-5544c6589-59kml
...
Connecting to broker  ns1-cc-broker-service
Connected.
JOB file and Request file are created:
Job file:  /em63_share/00010551.JOB
REQ file:  /em63_share/SESS0001.REQ
Looking for:  /em63_share/00010551.DAT
DAT file found. Processing ...
Start transfer: publishing...
#0       :      DATE            20190319
#1       :      TIME            08:27:51
#2       :      @ActSimPara1            5
#3       :      @ActSimPara2              1.6127
#4       :      ActCntCyc               40
#5       :      ActCntPrt               39
#6       :      ActStsMach              0A000
#7       :      ActTimCyc                 1.0012
#8       :      SetCntMld               1
#9       :      SetCntPrt               10000
---------------------------------------------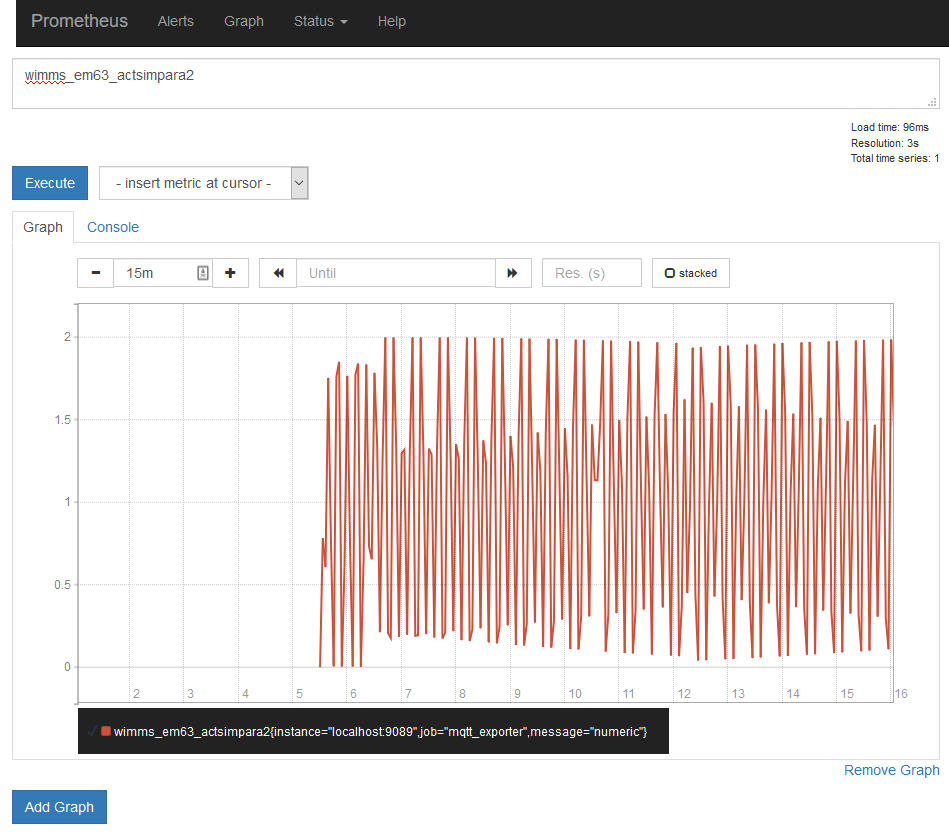
...The CC's Prometheus DB exposes a simple GUI to illustrate stored time series data.
$ kubectl get svc -l cnf=cc
NAME             TYPE           CLUSTER-IP       EXTERNAL-IP   PORT(S)                         AGE
ns1-cc-service   LoadBalancer   10.152.183.134   10.1.1.1      1883:30887/TCP,9090:32340/TCP   9m48s
Again, there are two options for accessing:
-
Through the LB service:
$ curl 10.1.1.1:9090
<a href="/graph">Found</a>.
-
Through the cluster's IP (
kubectl cluster-info) and thenodePort:$ kubectl cluster-info Kubernetes master is running at http://127.0.0.1:8080 Heapster is running at http://127.0.0.1:8080/api/v1/namespaces/kube-system/services/heapster/proxy KubeDNS is running at http://127.0.0.1:8080/api/v1/namespaces/kube-system/services/kube-dns:dns/proxy Grafana is running at http://127.0.0.1:8080/api/v1/namespaces/kube-system/services/monitoring-grafana/proxy InfluxDB is running at http://127.0.0.1:8080/api/v1/namespaces/kube-system/services/monitoring-influxdb:http/proxy $ curl 127.0.0.1:32340 <a href="/graph">Found</a>.
In the GUI, select the metric wimms_em63_actsimpara2, which should show a sinus-like curve if all VNFs and the DT are running correctly:
# stop the DT (can take a while)
docker stop vnf-dt

# stop NS1 and NS2 inside Kubernetes (also takes a while)
kubectl delete all -l pilot=sm
Additional info that may be useful but that is not strictly part of the deployment walkthrough. This info may be slightly outdated.
Important: In microk8s, Kubernetes DNS is disabled by default! You have to enable it first:
microk8s.enable dns dashboardAfter starting the deployment and services (see above), check the logs of the three VNFs to verify that the MQTT connection works. First get the pod names:
$ kubectl get pods
NAME                                           READY   STATUS              RESTARTS   AGE
ns1-cc-broker-deployment-867484cd6b-nxjsx      1/1     Running             0          2m10s
ns1-cc-processor-deployment-7d9ddc9599-c9gz2   1/1     Running             0          2m10s
ns1-eae-deployment-787c944c87-n88gm            1/1     Running             0          2m10s
ns2-mdc-deployment-5544c6589-r94x5             0/1     ContainerCreating   0          2s
Check logs of all VNFs using MQTT (MDC, CC broker, and CC processor):
# mdc (publish)
$ kubectl logs ns2-mdc-deployment-5544c6589-r94x5
SIOCADDRT: Operation not permitted
MDC: Configured route to NS1 over RTR:
Kernel IP routing table
Destination     Gateway         Genmask         Flags Metric Ref    Use Iface
0.0.0.0         172.17.0.1      0.0.0.0         UG    0      0        0 eth0
172.17.0.0      0.0.0.0         255.255.0.0     U     0      0        0 eth0
MDC: Starting SAMBA server (in background)...
MDC: Starting MDC VNF APP ...
debug_parse_params: unrecognized debug class name or format [verbose]
smbd version 4.3.11-Ubuntu started.
Copyright Andrew Tridgell and the Samba Team 1992-2015
STATUS=daemon 'smbd' finished starting up and ready to serve connections
---------------------------------------------
Machine defined:  WIMMS
Path defined:  /em63_share
Use  parameter.em63
Connecting to broker  ns1-cc-broker-service
Connected.
...

# cc broker (broker)
$ kubectl logs ns1-cc-broker-deployment-867484cd6b-nxjsx
CC-CDU01 (broker): Starting Mosquitto ...
1551443488: mosquitto version 1.5.7 starting
1551443488: Using default config.
1551443488: Opening ipv4 listen socket on port 1883.
1551443488: Opening ipv6 listen socket on port 1883.
1551443493: New connection from 172.17.0.4 on port 1883.
1551443493: New client connected from 172.17.0.4 as CC-Client-Sub (c1, k60).
1551443493: No will message specified.
1551443493: Sending CONNACK to CC-Client-Sub (0, 0)
1551443493: Received SUBSCRIBE from CC-Client-Sub
1551443493:     WIMMS/EM63/# (QoS 0)
1551443493: CC-Client-Sub 0 WIMMS/EM63/#
1551443493: Sending SUBACK to CC-Client-Sub
1551443553: Received PINGREQ from CC-Client-Sub
1551443553: Sending PINGRESP to CC-Client-Sub
1551443613: Received PINGREQ from CC-Client-Sub
1551443613: Sending PINGRESP to CC-Client-Sub
1551443617: New connection from 172.17.0.10 on port 1883.
1551443617: New client connected from 172.17.0.10 as WIMMS-client-pub (c1, k60).
...

# cc processor (subscribe)
$ kubectl logs ns1-cc-processor-deployment-7d9ddc9599-c9gz2
CC-CDU02 (processor): Starting Azure Cloud Connector ...
Cloud connection disabled. Not reading json.keys. ENABLE_CLOUD_CONNECTION = False
---------------------------------------------
Connecting to MQTT broker: ns1-cc-broker-service:1883
Subscribing to MQTT broker's topic WIMMS/EM63/#
---------------------------------------------
...Note: This may be subject to change as details of the services (e.g., ports) are updated.
Check that the service is running:
$ kubectl get services ns1-eae-service
NAME              TYPE        CLUSTER-IP       EXTERNAL-IP   PORT(S)   AGE
ns1-eae-service   ClusterIP   10.152.183.204   <none>        80/TCP    5m18s
Connect to one of the other pods (e.g., CC broker) and try to access the EAE's dashboard:
$ kubectl exec -it ns1-cc-broker-deployment-867484cd6b-4krr2 -- /bin/bash
root@ns1-cc-broker-deployment-867484cd6b-4krr2:/# curl ns1-eae-service
<a href="/login">Found</a>.
Works!
The typical way to expose a service to the outside would be using a LoadBalancer k8s service. In a cloud, e.g., AWS, this would create the default load balancer and connect it to the different pods of the service. From the outside the pods could be reached through the LB.
But this doesn't work with Minikube or microk8s out of the box. That's why we installed and configured MetalLB at the beginning.
The exposed service can be accessed via <LB-external-ip>:<targetPort>. Note that typically targetPort = port != nodePort.
A NodePort service exposes a service on a random or specified nodePort at the cluster's node. It can be accessed via <cluster/node-ip>:<node-port>.
One limitation is that original port numbers are mapped to numbers in the range 30000-32767. If we want to keep the original port numbers, e.g., for Samba, where they cannot be reconfigured, we need to a) set fixed nodePorts in the Kubernetes NodePort service description and b) to start minikube/microk8s with a custom port range that includes the ports that we want to expose.
In minikube, this works as follows:
# important: make sure that these ports don't conflict with sth else running on the machine!
minikube start --extra-config=apiserver.service-node-port-range=137-445
In microk8s, this doesn't work.
An Ingress does not expose arbitrary ports or protocols. Exposing services other than HTTP and HTTPS to the internet typically uses a service of type Service.Type=NodePort or Service.Type=LoadBalancer.
Hence, an ingress may be good choice for the EAE, but not for the MDC because we must not change the Samba ports.
- Service debugging
- Connect frontend to backend example
- Use services to connect
-
NodePortis fine for single-node deployments like minikube or microk8s (default, ie,LoadBalancernot supported there, I think) - Different port specifications:
-
port: Port of the service to use in order to access a certain container -
targetPort: Port of the container that the service should connect to (default: same asport). Can be thenameof the container's port, such that the port number can change without breaking the service. -
nodePort: Externally exposed port to access the service (default: random in range 30000–32767)
-
When accessing a specific container, you always need the pod name (kubectl get pods). As we assume 1 CDU = 1 pod, we always only have one container per pod and don't need further selection of containers within a pod.
Attach to running container:
kubectl attach -it ns1-cc-broker-deployment-867484cd6b-s8f7kConnect to running container and get shell access:
kubectl exec -it ns1-cc-broker-deployment-867484cd6b-s8f7k -- /bin/bashNote: On Windows, MINGW64 (git bash) does not seem to work (Unable to use a TTY...), but PowerShell does.
Useful flag: -f streams the log output continously
Get logs from a container (from stdout):
kubectl logs ns1-cc-broker-deployment-867484cd6b-s8f7kFrom all containers of a service:
kubectl logs -l ns=ns1 --all-containers=trueYou can also use different selectors, e.g., cnf=cc, pilot=sm.
In the CC client:
# get bash access
kubectl exec -it sm-ns1-deployment-975657c95-g5sx5 -- /bin/bash

# inside the container, use the mosquitto client to connect to the broker at port 1883 (and test topic "abc")
root@sm-ns1-deployment-975657c95-g5sx5:/# mosquitto_sub -d -h ns1-cc-broker-service -p 1883 -t abc
Client mosqsub|29-sm-ns1-deplo sending CONNECT
Client mosqsub|29-sm-ns1-deplo received CONNACK (0)
Client mosqsub|29-sm-ns1-deplo sending SUBSCRIBE (Mid: 1, Topic: abc, QoS: 0)
Client mosqsub|29-sm-ns1-deplo received SUBACK
Subscribed (mid: 1): 0
# connection successful!
At the same time watch the logs of the CC broker:
$ kubectl logs -f ns1-cc-broker-deployment-867484cd6b-s8f7k
CC-CDU01 (broker): Starting Mosquitto ...
1550678435: mosquitto version 1.5.5 starting
1550678435: Using default config.
1550678435: Opening ipv4 listen socket on port 1883.
1550678435: Opening ipv6 listen socket on port 1883.Important: With introduction of the LoadBalancer service for external access of the EAE and the MDC, deployment on Windows with minikube doesn't work anymore! I can figure out how to configure the MetalLB on Windows to work correctly...
- Option 1: If you have Docker for Desktop, you can simply enable Kubernetes in the settings
- Option 2: You can download the binaries for
kubectlandminikubeand add them to your path as described here
Here, DNS seems to be enabled by default. Check with kubectl cluster-info.
minikube start
# check status
minikube status- Deployment: Desired state of an app. Specifies containers, number of replications, etc.
- Service: (External) access, abstraction and load balancing to deployed app
- When no service object is explicitly defined in a descriptor or started manually, a
ClusterIPservice is automatically started for each deployment, which allows cluster-internal access only
- When no service object is explicitly defined in a descriptor or started manually, a
- Ingress: Can simplify external access to a service
- Pod: Created/destroyed automatically as part of a deployment
- Kubernetes objects: Described using yaml, which specify the desired state of an object (here: network service)
- Labels: Arbitrary key-value-pairs to easily identify and select any object (e.g., deployment or service)
- Minikube quickstart
- Most important Kubernetes terminology
- Kubernetes equivalents to typical Docker commands
- Differences between NodePort, LoadBalancer, Ingress
- Kubernetes: Using a service to expose your app
- Exposing an External IP Address to Access an Application in a Cluster
# start container, which is available on DockerHub
kubectl run --image=sonatanfv/vnf-eae:k8s eae-vnf --port=3000
# expose the deployed container by creating a service
kubectl expose deployment eae-vnf --type=NodePort
# check the container is running
kubectl get podsIn minikube, you can access the service using minikube service eae-vnf, which will open a browser and navigate to the URL of the service.
You can also check the minikube dashboard, by calling minikube dashboard.
Otherwise, kubectl cluster-info will give you the IP address of the cluster, where you'll be able to access the VNF via the port set at kubectl run (in this case 3000).
You can now access the Grafana dashboard, which is deployed via k8s.