

![]()
This project contains the JetBrains IDE plugin for Source++, the continuous feedback platform for developers. Increase code comprehension with developer-native observability technology, safely debug production applications with negligible to minimal overhead, and gain continuous insight into your application in its natural environment.
| Live Insight | Live Instrument |
|---|---|
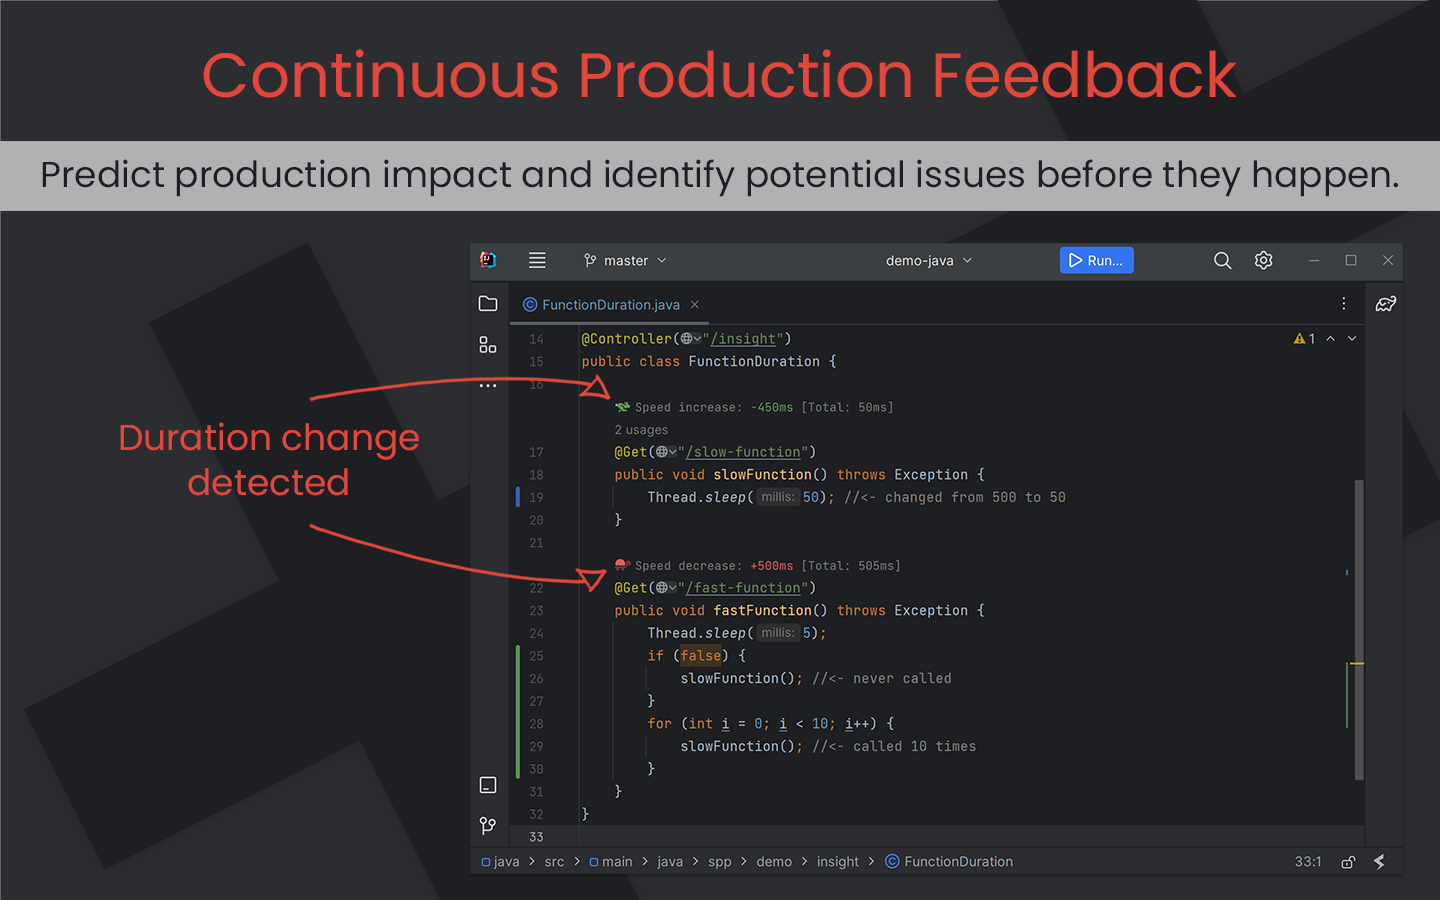
|
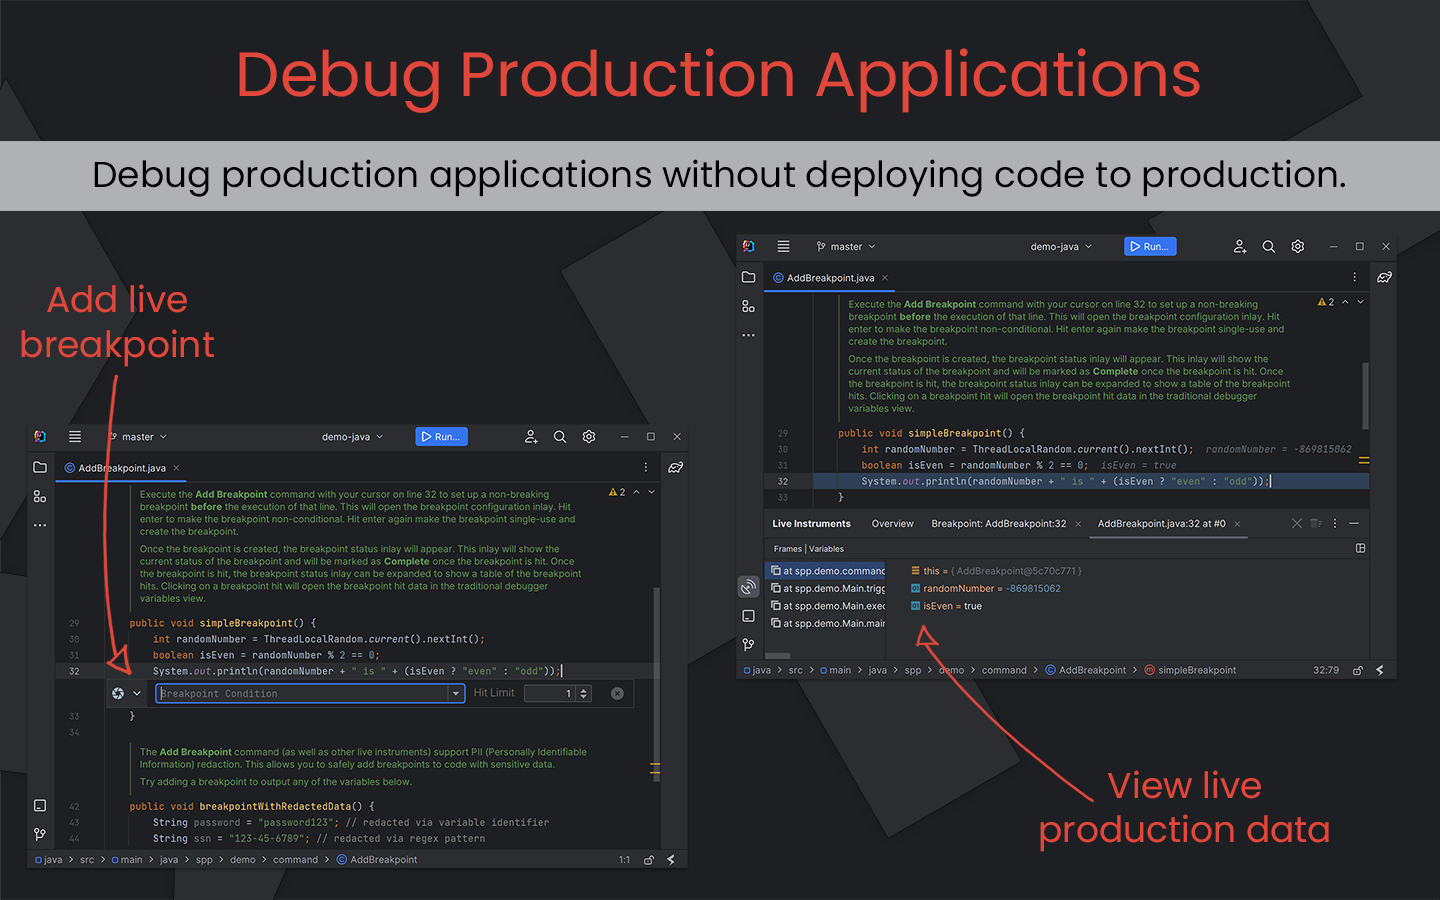
|
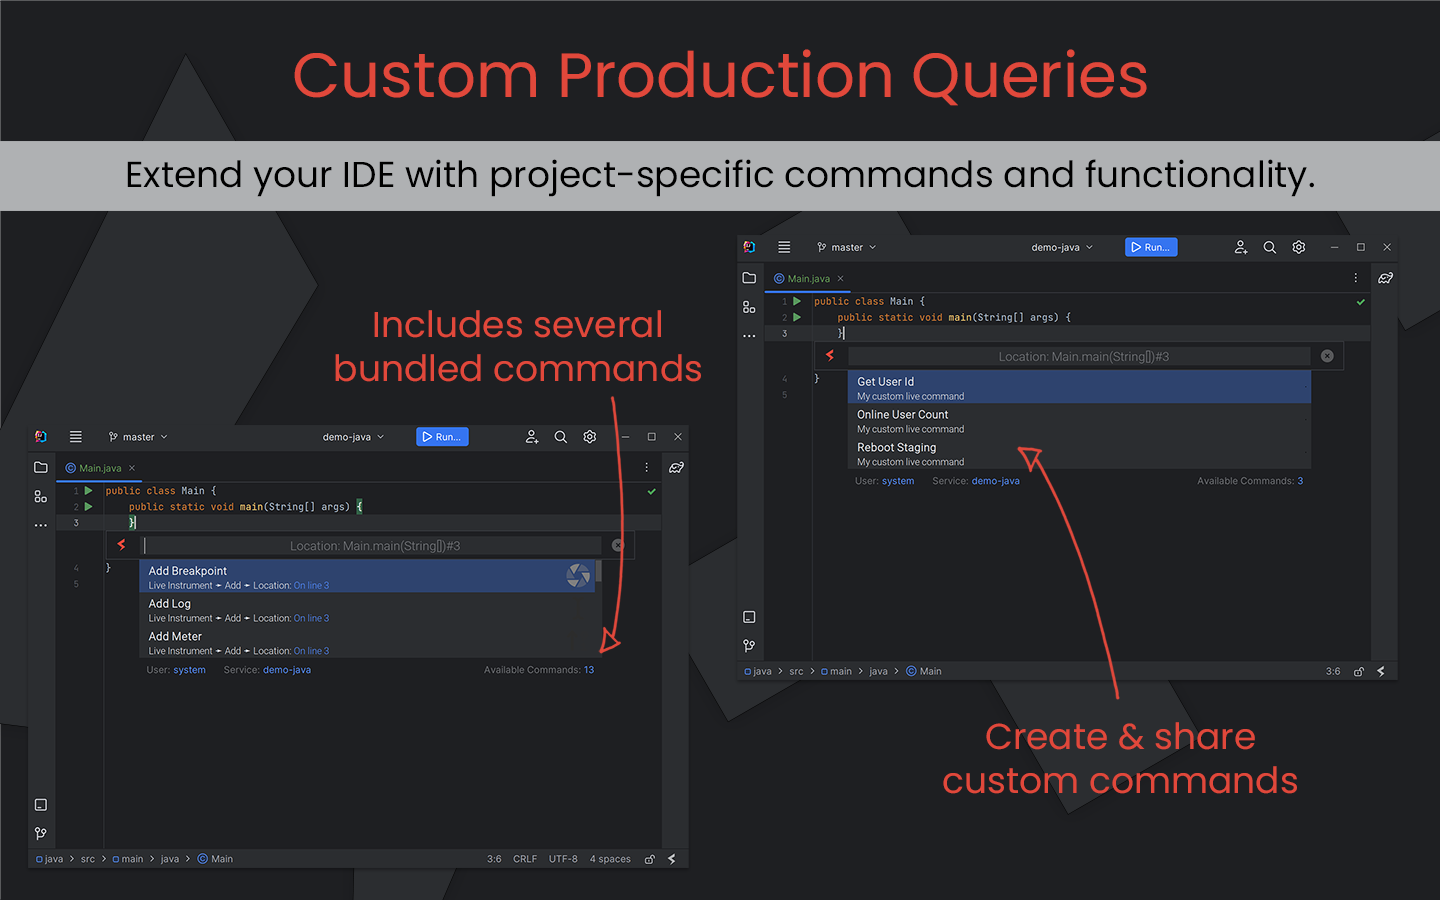
| Live View | Live Command |
|---|---|
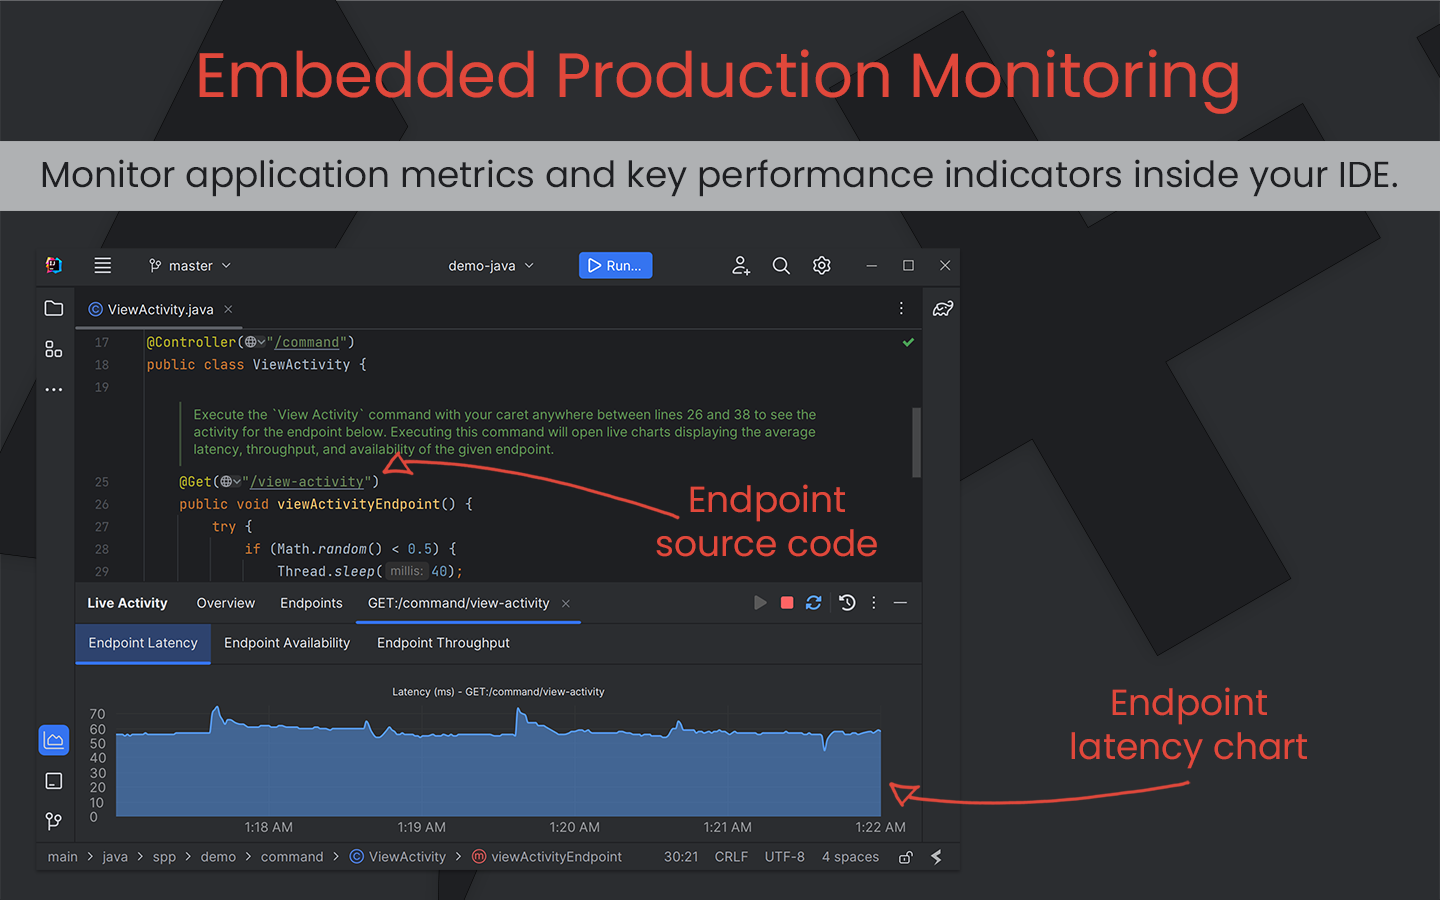
|
|
Install the Source++ plugin via the JetBrains Marketplace by searching for: Source++.
Alternatively, you can download the Source++ plugin directly
from here.
Once installed, this plugin adds
the Live Command Palette to the JetBrains
IDE, which is accessible by typing Ctrl+Shift+S. The available commands are determined by the location of the live
command palette and the accessibility of the Source++ Platform.
For more information, please see the documentation.
Bug reports and feature requests can be created here.