Skip to content
New issue

Have a question about this project? Sign up for a free GitHub account to open an issue and contact its maintainers and the community.

By clicking “Sign up for GitHub”, you agree to our terms of service and privacy statement. We’ll occasionally send you account related emails.

Already on GitHub? Sign in to your account

[Possible Bug] IntensityTable concatenate_intensity_tables() 'TAKE_MAX' strategy does not appear to be working quite right #1432

Closed
njmei opened this issue Jul 1, 2019 · 20 comments

Comments

@njmei
Copy link
Contributor

njmei commented Jul 1, 2019

Some quick and dirty test code I wrote:

import numpy as np
import xarray as xr

from starfish import IntensityTable

from starfish.core.types import Coordinates, Features
from starfish.core.types._constants import OverlapStrategy
from starfish.core.codebook.test.factories import codebook_array_factory
from starfish.core.intensity_table.test.factories import create_intensity_table_with_coords
from starfish.core.intensity_table.overlap import Area

import matplotlib.pyplot as plt
import matplotlib.patches


def plot_intensity_tables(intensity_table_plot_specs, concatenated_table):
    
    fig, ax = plt.subplots(dpi=500)
    
    for table, color, marker, coord, x_dim, y_dim in intensity_table_plot_specs:
        ax.scatter(table['xc'], table['yc'], facecolors='none', marker=marker, linewidth=0.25, s=15, edgecolors=color)
        rect = matplotlib.patches.Rectangle(coord, x_dim, y_dim, edgecolor='none', facecolor=color, alpha=0.10)
        ax.add_patch(rect)

    ax.scatter(concatenated_table['xc'], concatenated_table['yc'], facecolors='none', marker='^', linewidth=0.25, s=15, edgecolors='black')
        
    fig.tight_layout()


def create_more_realistic_intensity_table_with_coords(area: Area, n_spots: int=10, random_seed=888) -> IntensityTable:
    codebook = codebook_array_factory()
    it = IntensityTable.synthetic_intensities(
        codebook,
        num_z=1,
        height=50,
        width=50,
        n_spots=n_spots
    )
    
    np.random.seed(random_seed)
    it[Coordinates.X.value] = xr.DataArray(np.random.uniform(area.min_x, area.max_x, n_spots),
                                           dims=Features.AXIS)
    it[Coordinates.Y.value] = xr.DataArray(np.random.uniform(area.min_y, area.max_y, n_spots),
                                           dims=Features.AXIS)
    # 'Restore' random seed so downstream usages aren't affected
    np.random.seed()

    return it


def test_take_max_of_multiple_overlaps():
    
    it1 = create_more_realistic_intensity_table_with_coords(Area(min_x=0, max_x=3,
                                                  min_y=2, max_y=5), n_spots=29)
    it2 = create_more_realistic_intensity_table_with_coords(Area(min_x=2, max_x=5,
                                                  min_y=2, max_y=5), n_spots=31)
    it3 = create_more_realistic_intensity_table_with_coords(Area(min_x=0, max_x=3,
                                                  min_y=0, max_y=3), n_spots=37)
    it4 = create_more_realistic_intensity_table_with_coords(Area(min_x=2, max_x=5,
                                                  min_y=0, max_y=3), n_spots=41)
    
    concatenated = IntensityTable.concatenate_intensity_tables(
        [it1, it2, it3, it4], overlap_strategy=OverlapStrategy.TAKE_MAX)


    tables = [it1, it2, it3, it4]
    colors = ['r', 'g', 'b', 'gold']
    markers = ['*', 'D', 's', '*']
    coords = [(0, 2), (2, 2), (0, 0), (2, 0)]
    x_dims = [3, 3, 3, 3]
    y_dims = [3, 3, 3, 3]
    
    plot_intensity_tables(zip(tables, colors, markers, coords, x_dims, y_dims), concatenated)

    
    print(concatenated.sizes[Features.AXIS])

The weird result:
Black Triangles = spots in concatenated
Other colored shapes = spots associated with a given color quadrant

Screenshot from 2019-07-01 14-13-58

The center quad overlap area shouldn't have that blue square or yellow star surviving in the concatenated table.
Also in the overlap area between yellow and blue, there are two anomalous blue spots that somehow survive the TAKE_MAX process...
Finally there is a surviving red star in the overlap between red and green.

Note also that this test code also doesn't even test for when Z-overlaps might occur.

CC: @berl

@ttung
Copy link
Collaborator

ttung commented Jul 1, 2019

@shanaxel42

@shanaxel42
Copy link
Collaborator

shanaxel42 commented Jul 1, 2019

I think your problem may be with the way you're setting up the physical coordinates on your IntensityTables using np.random.uniform doesn't make sense, since we're expecting the physical coordinates to be in order and use where < > logic to do the overlap comparisons.

You should instead use np.linspace which is what we're using to set up the physical coords on the Imagestacks xr.DataArray(np.linespace(area.min_x, area.max_x, n_spots), dims=Features.AXIS)

@berl
Copy link
Collaborator

berl commented Jul 1, 2019

thanks @njmei for this. I do expect the multi-overlap areas to be potentially inconsistent because the tile with the highest number of spots in the multi-overlap area might be different than the tile with highest number of spots in a pairwise overlapping area. This just comes with the territory of building the results out of pairwise take_max operations and it's a known limitation.

I also think leaving the z coordinates out was a known limitation going into this, but the example above does look like a bug. (oops just saw @shanaxel42's comment.... I look forward to the resolution you two!)

@njmei
Copy link
Contributor Author

njmei commented Jul 1, 2019

@shanaxel42 Thanks for the speedy reply! I'll try a sort of the x,y coordinates and see if that resolves the issue!

EDIT: Are coordinates sorted by x then y? or y then x?

@shanaxel42
Copy link
Collaborator

@shanaxel42 Thanks for the speedy reply! I'll try a sort of the x,y coordinates and see if that resolves the issue!

EDIT: Are coordinates sorted by x then y? or y then x?

ok so sorry @njmei I take back my previous comment about np.random.uniform. The order of the coords shouldn't matter and the overlap logic should still work. Which means I need to keep looking at your code, sorry!

@njmei
Copy link
Contributor Author

njmei commented Jul 1, 2019

@shanaxel42 oh, well if it's helpful this version sorts by y_values then x_values but the problem still exists

def create_more_realistic_intensity_table_with_coords(area: Area, n_spots: int=10, random_seed=888) -> IntensityTable:
    codebook = codebook_array_factory()
    it = IntensityTable.synthetic_intensities(
        codebook,
        num_z=1,
        height=50,
        width=50,
        n_spots=n_spots
    )
    
    np.random.seed(random_seed)
    x_values = np.random.uniform(area.min_x, area.max_x, n_spots)
    y_values = np.random.uniform(area.min_y, area.max_y, n_spots)
    # Lexsort uses the last column as primary sort key
    # Sort by y_values, then by x_values
    sorted_inds = np.lexsort((x_values, y_values))
    
    it[Coordinates.X.value] = xr.DataArray(x_values[sorted_inds],
                                           dims=Features.AXIS)
    it[Coordinates.Y.value] = xr.DataArray(y_values[sorted_inds],
                                           dims=Features.AXIS)
    # 'Restore' random seed so downstream usages aren't affected
    np.random.seed()

    return it

@shanaxel42
Copy link
Collaborator

ok! Have done a bit more deep diving into this and I believe I understand what's happening. So one important thing to note is that when defining the boundaries of an IntensityTable during the overlap code I use the min/max values for x and y. So even though you may create an IntenistyTable with x coords in a range from 0 to 3, the min max values won't necessarily be 0 and 3. They are the min/max actual spot positions. For example the first IntensityTable you create it1 = create_more_realistic_intensity_table_with_coords(Area(min_x=0, max_x=3, min_y=2, max_y=5), n_spots=29) actual xrange is 0.004 to 2.77. This creates kind of a misleading plot diagram because you're plotting the min/max values you supplied in creating the intenistyTables but not their actual min/max vals. The second thing to note is that when removing spots from the "losing" intensityTable, I'm not removing spots from the boundary of the intersection area. ( this logic could be changed if we don't think this makes sense). So this results in what looks like random spots that survived in the intersection area but are actually spots that were on the edge of the "true" intersection area and so were therefore not removed. Does this make sense? I can definitely changes the boundary logic but if you want a clearer picture of what's going on you'll need to plot the IntenistyTables by their actual min/max coordinates not the supplied ones.

@njmei
Copy link
Contributor Author

njmei commented Jul 2, 2019

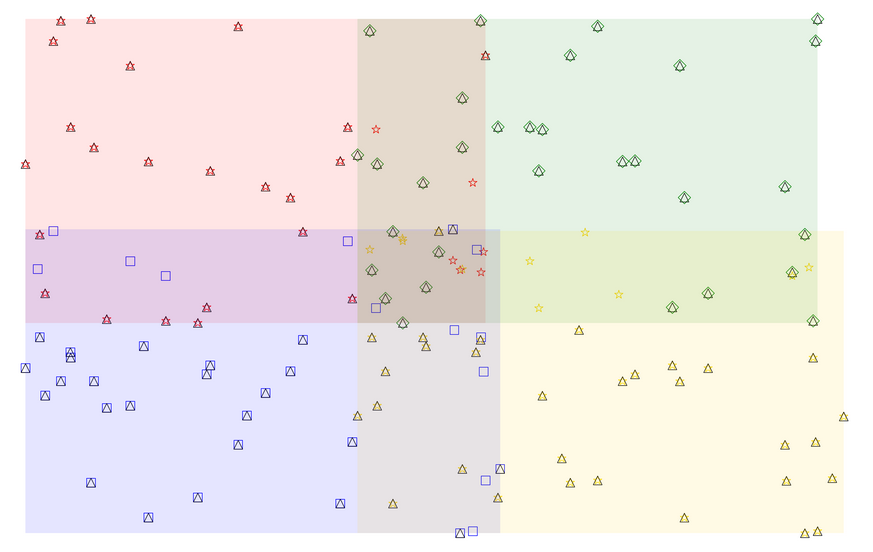
Gotcha, many thanks for digging into this @shanaxel42! This is a bit different from how Brian had described this functionality to me...

I replotted the example plot using the x,y min and max values to define boundaries as you described:

Screenshot from 2019-07-02 11-57-31

It's clear now that the the blue square in the quad intersection, the two blue squares in the yellow/blue intersection, and the red star in the red/green intersection are literally on the boundaries, but are on outer boundary area for their 'zone' rather than the internal boundary. So those spots should probably be removed?

The yellow star in the quad intersection is still a big ??? though.

I'm going to defer to @berl on if this implementation is okay.

@njmei
Copy link
Contributor Author

njmei commented Jul 3, 2019

@shanaxel42 On a related note, does the TAKE_MAX strategy make sure to only apply itself on a per round basis?

I see some discrepancies in the sum of features in IntensityTables when I treat rounds as separate 'Starfish experiments' vs. when I treat them as part of the same 'Starfish experiment'.

Example:

Full test dataset experiment IntensityTable (Round 0 + Round 1) has 677990 features

The constituent rounds when processed individually have:
Round 0: 524173 features
Round 1: 154539 features

678712 != 677990

@shanaxel42
Copy link
Collaborator

the overlap code doesn't do anything special on a per round basis. It just compares two intensityTables based of physical coords. I'm guessing that the difference in spots has to do with the spot finding difference @ambrosejcarr mentioned this morning, the max_proj strategy?

@njmei
Copy link
Contributor Author

njmei commented Jul 3, 2019

I guess what I'm wondering is:
I see functions like remove_area_of_xarray() and sel_area_of_xarray() that select portions of the xarray based on xc, yc, and zc coordinates, but wouldn't that also be selecting across rounds in the xarray as well? Maybe it doesn't as I don't understand xarray super well...

@shanaxel42
Copy link
Collaborator

You understand it right, it selects/removes across the rounds. But maybe that's not the functionality you're looking for? The TAKE_MAX method was written specifically for you guys so if it's not working as expected that's completely my bad in misunderstanding your requirements.

@njmei
Copy link
Contributor Author

njmei commented Jul 3, 2019

I think having any overlap strategy select/remove across rounds will result in overeager removal of spots. Not sure scientifically if this is a big deal, but this definitely would explain why I get discrepencies in number of IntensityTable features when I process each round separately as its own experiment vs when I process rounds together as part of an experiment...

CC: @berl

@berl
Copy link
Collaborator

berl commented Jul 9, 2019

Yeah, if it's done across all rounds, this strategy will result in some inconsistent results that we should avoid. This is probably on me- I should have been more careful when I first described this issue!

The alignment within a round is assumed to be perfect here so all channels within a round can be treated together, but each round can have a different xc,yc offset, so they can't all be taken care of in one TAKE_MAX operation.

An important knock-on effect of this @njmei points out above: doing the TAKE_MAX for each round and then merging rounds should have the same outcome as merging rounds and then doing the TAKE_MAX.

@shanaxel42
Copy link
Collaborator

@njmei and @berl but I thought you guys were processing per round? I think it makes sense to keep the take_max strategy simply "take the max of the two intensity tables" doing something more complicated like parsing through each round I think would call for a different strategy.

@njmei
Copy link
Contributor Author

njmei commented Jul 10, 2019

@shanaxel42

Yes, it's definitely true that we're aiming for per-round processing. But we will need the ability to also do full experiment processing simply because there will be situations where already processed datasets will need to be revisited with tweaks to preprocessing/spotfinding hyperparameters (or maybe needing new algorithms applied).

This is also why having different results when processing each individual round (as separate 'experiments') vs processing all rounds (as one 'experiment') is a big problem.

@berl
Copy link
Collaborator

berl commented Jul 10, 2019

@shanaxel42 would iterating over rounds and doing the TAKE_MAX for each round really be that bad? There's definitely the possibility of confusion if people expected the other behavior, so I'd be fine with a flag for per_round max. @njmei has elucidated our fundamental ask here- we want the results from per-round processing and all-at-once processing to be the same.

@ambrosejcarr
Copy link
Member

we want the results from per-round processing and all-at-once processing to be the same.

When we figure out the difference, I think it would be a good idea for our tests to check for this.

@ambrosejcarr
Copy link
Member

ambrosejcarr commented Jul 10, 2019

@shanaxel42 would iterating over rounds and doing the TAKE_MAX for each round really be that bad? There's definitely the possibility of confusion if people expected the other behavior, so I'd be fine with a flag for per_round max. @njmei has elucidated our fundamental ask here- we want the results from per-round processing and all-at-once processing to be the same.

Upon reflection, am I correct that in the long term, we'd like to figure out how to resolve overlapping sections, which will require us to merge duplicated spots?

If that's right, I think you have the right short term solution here, which is to add a flag that enables one to select the granularity over which the TAKE_MAX operates so that the user can obtain consistency between different round/experiment workflows.

I don't have a great feeling for what the best default is. My best guess is that it's potentially per tile, if you want to err on the side of keeping data.

@shanaxel42
Copy link
Collaborator

closing in favor of #1453 @njmei let me know if I should reopen!

Sign up for free to join this conversation on GitHub. Already have an account? Sign in to comment
Labels
None yet
Projects
None yet
Development

No branches or pull requests

5 participants