Made for monitoring minecraft. Yes, this is insane. So the idea is something like this:
Nuclear Reactor (in minecraft) --> OpenComputers monitoring script `monitor.lua` --> Redis
This project --> redis --> push to statsd
Statsd --> InfluxDB --> Grafana (actual metrics)
This is the way I decided to do it because Redis was fairly trivial to get data into from a lua shell running in Minecraft (if you haven't played with opencomputers ... wow, it's hilariously awesome).
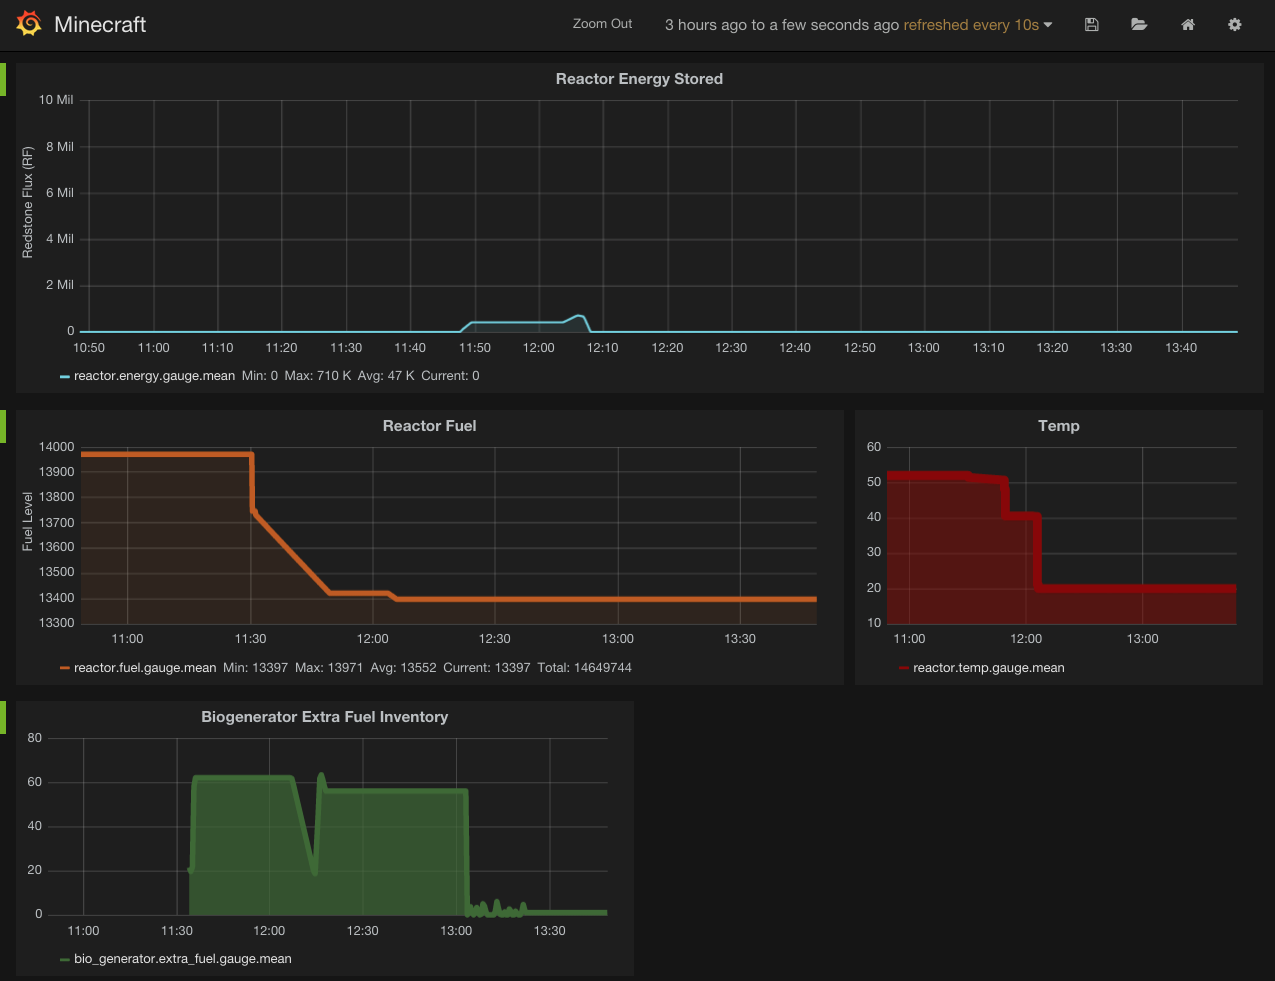
Within minecraft, there's a lot to say and I can't say it all here.
Tech mods in minecraft are complicated. Tweet me at @squarism on
twitter and I can make a video. Here's a quick rundown.
- You need a computer built
- It needs to have an "Internet Card" installed in it so it can talk with the outside world.
- OpenComputers.cfg needs to be modified to un-blacklist whatever Redis server you intend to push data to.
- Whatever thing you are monitoring needs to have a connection to your (minecraft) computer. For example, the canonical example is monitoring a nuclear reactor.
componentsshould showbr_reactor. This is all opencomputers stuff. They have an excellent youtube video tutorial series. - You need my redis client for opencomputers: opencomputers_redis
- Then you need to fire up the
monitor.luamonitoring script to push data to Redis. Copymonitor.luato/usr/binor wherever you want. Unforunately, it doesn't run as a daemon yet. - Then you need to run this project to monitor Redis to push it to statsd.
- Copy
monitor.luato your minecraft computer (opencomputers). Edit the redis URL where it saysCHANGE_MEto be your redis server. cp .env.sample .env(change hostnames etc in there)- Install ruby if you haven't already. It ships on mac, otherwise, I'd
use RVM to install ruby.
gem install bundler- run
bundle
- run
rakein tmux or in the background while you play minecraft - run
monitor.luain minecraft.
You should see events hit influxdb. You can use the query select * from /.*/ limit 1 in the influxdb console. Even before that, you
should see data in redis keys *. Be sure to note which redis database
number you configured.
Perhaps pushing straight to statsd would be better. Maybe this project will move to that. I kind of like pushing to Redis though because then you don't have to think about time gaps (maybe). This project could potentially just push straight to influxdb. I'm just worried that the value of statsd will be minimal with the time averaging because noone's minecraft game is running 24/7. So will there be massive gaps in data that cause weird averaging?