A Gnuplot template-script generator for easy multiplot setup written in Python.
This template generator was written to easily setup Gnuplot multiplots with non-standard paddings and margins between the plots, e.g. for placing graphs right next to each other when they share their X- and Y-axes.
This can be implemented in Gnuplot by manually setting individual margins tmargin, bmargin, lmargin and rmargin for each graph of the multiplot canvas as explained here.
Run the script like any other Python script on your system. The generated script is send to stdout.
Configuring the generated multiplot template is done via the following variables in the script.
# ---------- Configuration ----------
# Number of lines and columns (number of plots in X and Y direction)
lines = 2
cols = 3
# Paddings of all four sides
pad_top = 0.1
pad_bot = 0.1
pad_left = 0.1
pad_right = 0.1
# Margins between the plots
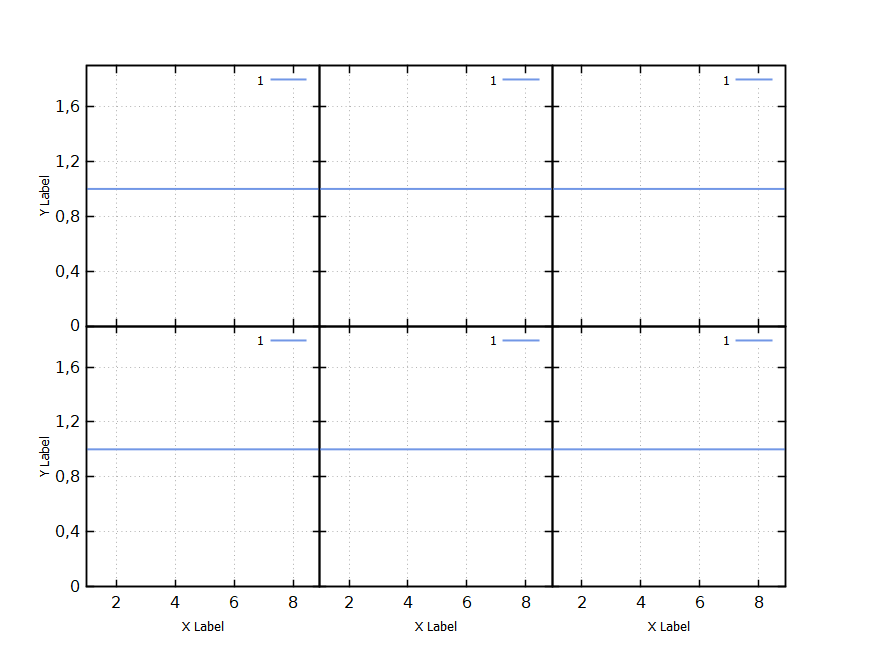
plot_x_margin = 0.01
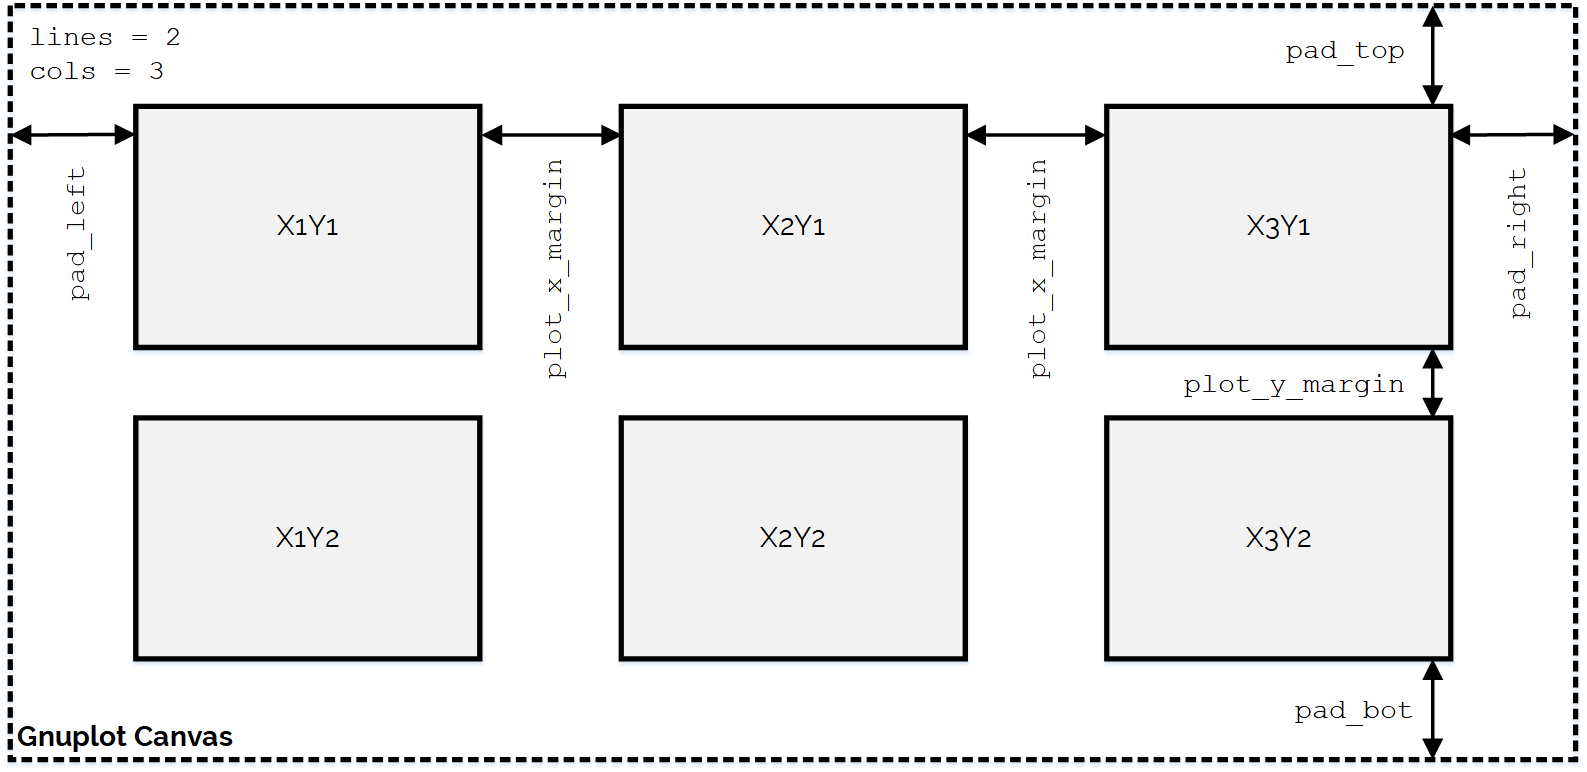
plot_y_margin = 0.01The variables lines and cols define the dimensions of the generated multiplot-matrix, where lines * cols equals the total number of graphs in the plot.
The other variables are paddings and margins. See the image below to understand what they do.
These variables are given in relative units, e.g. pad_left = 0.1 will reserve 10% of the total width of the canvas on the left side for Y-Labels.
The variables plot_x_margin and plot_y_margin can be set to 0. In this case, their will be no margins between the graphs and their axes will touch.
By default only the X- and Y-labels of the lowermost and leftmost graphs are shown.
There are two more additional variables:
plot_commandshould be a string. This will be placed as a placeholder plot-command in the generated template.plot_addshould also be string. If it is not empty, it will be placed in front of each plot-command.
Generator configuration
# ---------- Configuration ----------
# Number of lines and columns (number of plots in X and Y direction)
lines = 2
cols = 3

# Paddings of all four sides
pad_top = 0.1
pad_bot = 0.1
pad_left = 0.1
pad_right = 0.1
# Margins between the plots
plot_x_margin = 0.01
plot_y_margin = 0.01
Generated template script
Y1MARGIN = "set tmargin at screen 0.900000; set bmargin at screen 0.505000"
Y2MARGIN = "set tmargin at screen 0.495000; set bmargin at screen 0.100000"
X1MARGIN = "set lmargin at screen 0.100000; set rmargin at screen 0.360000"
X2MARGIN = "set lmargin at screen 0.370000; set rmargin at screen 0.630000"
X3MARGIN = "set lmargin at screen 0.640000; set rmargin at screen 0.900000"

NOXTICS = "set format x ''; unset xlabel"
NOYTICS = "set format y ''; unset ylabel"
XTICS = "set format x '%g'; set xlabel 'X'"
YTICS = "set format y '%g'; set ylabel 'Y'"
set multiplot layout 2,3
@Y1MARGIN; @X1MARGIN; @NOXTICS; @YTICS;
plot 1
@Y1MARGIN; @X2MARGIN; @NOXTICS; @NOYTICS;
plot 1
@Y1MARGIN; @X3MARGIN; @NOXTICS; @NOYTICS;
plot 1
@Y2MARGIN; @X1MARGIN; @XTICS; @YTICS;
plot 1
@Y2MARGIN; @X2MARGIN; @XTICS; @NOYTICS;
plot 1
@Y2MARGIN; @X3MARGIN; @XTICS; @NOYTICS;
plot 1
unset multiplot
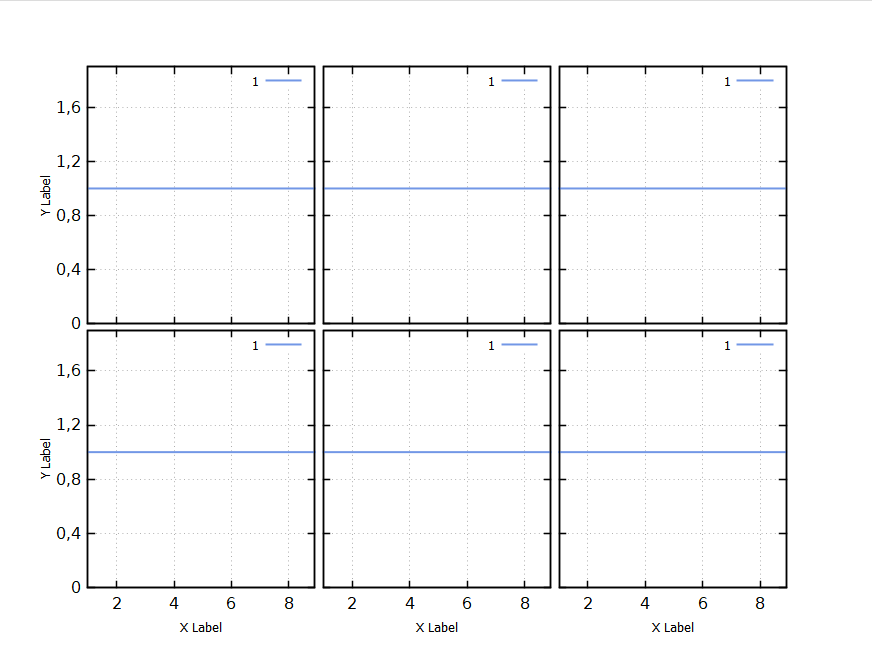
Generator configuration
# ---------- Configuration ----------
# Number of lines and columns (number of plots in X and Y direction)
lines = 2
cols = 3

# Paddings of all four sides
pad_top = 0.1
pad_bot = 0.1
pad_left = 0.1
pad_right = 0.1
# Margins between the plots
plot_x_margin = 0.0
plot_y_margin = 0.0
Generated template script
Y1MARGIN = "set tmargin at screen 0.900000; set bmargin at screen 0.500000"
Y2MARGIN = "set tmargin at screen 0.500000; set bmargin at screen 0.100000"
X1MARGIN = "set lmargin at screen 0.100000; set rmargin at screen 0.366667"
X2MARGIN = "set lmargin at screen 0.366667; set rmargin at screen 0.633333"
X3MARGIN = "set lmargin at screen 0.633333; set rmargin at screen 0.900000"

NOXTICS = "set format x ''; unset xlabel"
NOYTICS = "set format y ''; unset ylabel"
XTICS = "set format x '%g'; set xlabel 'X'"
YTICS = "set format y '%g'; set ylabel 'Y'"
set multiplot layout 2,3
@Y1MARGIN; @X1MARGIN; @NOXTICS; @YTICS;
plot 1
@Y1MARGIN; @X2MARGIN; @NOXTICS; @NOYTICS;
plot 1
@Y1MARGIN; @X3MARGIN; @NOXTICS; @NOYTICS;
plot 1
@Y2MARGIN; @X1MARGIN; @XTICS; @YTICS;
plot 1
@Y2MARGIN; @X2MARGIN; @XTICS; @NOYTICS;
plot 1
@Y2MARGIN; @X3MARGIN; @XTICS; @NOYTICS;
plot 1
unset multiplot