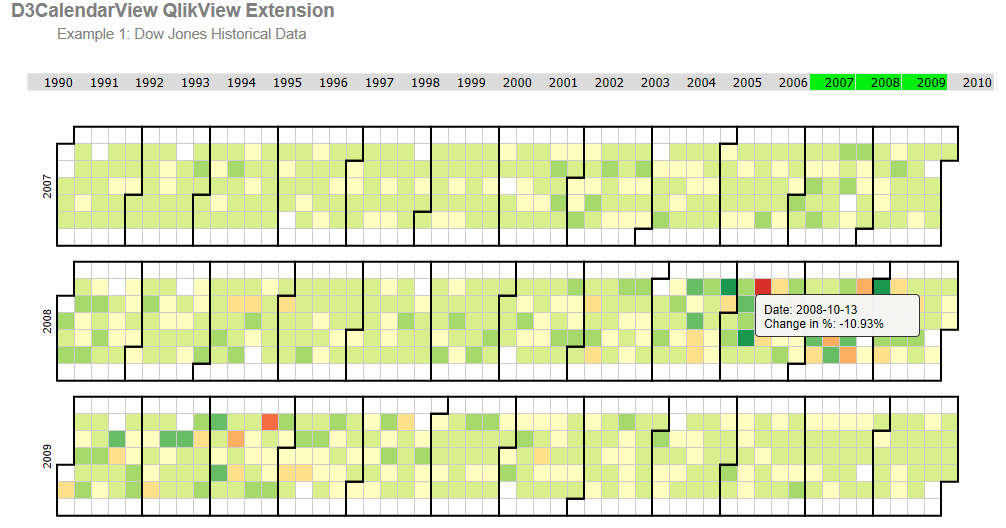
Use this QlikView Extension is the perfect choice if you want to display a lot of data on a day-per-day basis. The data passed to the extension is displayed in a diverging color scale. The values are visualized as colored cells per day. Days are arranged into columns by week, then grouped by month and years.
D3CalendarView QlikView Extension in Action:

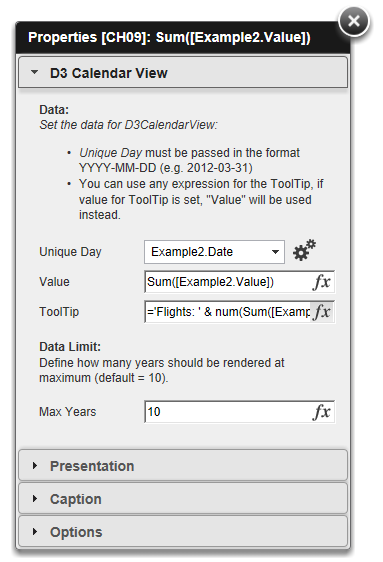
Configuration Dialog:
Installation of the QlikView Extension is straightforward, there is nothing special to take care of:
- Download the extension + Sample QlikView application
- Install the extension on your local computer (doubleclick the .qar file)
- Drag’n’Drop the extension within QlikView Desktop (using WebView)
- Finally deploy the extension to your server (→ detailed instruction)
The table below explains the properties available for configuring the behavior of this extension:
| Property | Type | Description |
|---|---|---|
| Unique Day | Date | Format: YYYY-MM-DD |
| Value | Numeric | Numeric value for the given day |
| ToolTip | String | String value to be used by the ToolTip |
| Max Years | Integer | Limit the years to be rendered (default = 10) |
Tested and developed for the following systems:
- Windows 7, Windows 8, Windows 2012
- You'll need a modern browser which supports SVG
- QlikView 11 SR2+, QlikView 11.2
- See Change Log
- Implement different color schemas
- Currently you can only select a single day, I could imagine that it would be helpful to select also weeks and months
- Display a color-legend
The software is made available "AS IS" without any warranty of any kind under the MIT License (MIT). Since this is a private project QlikTech support agreement does not cover support for this software.