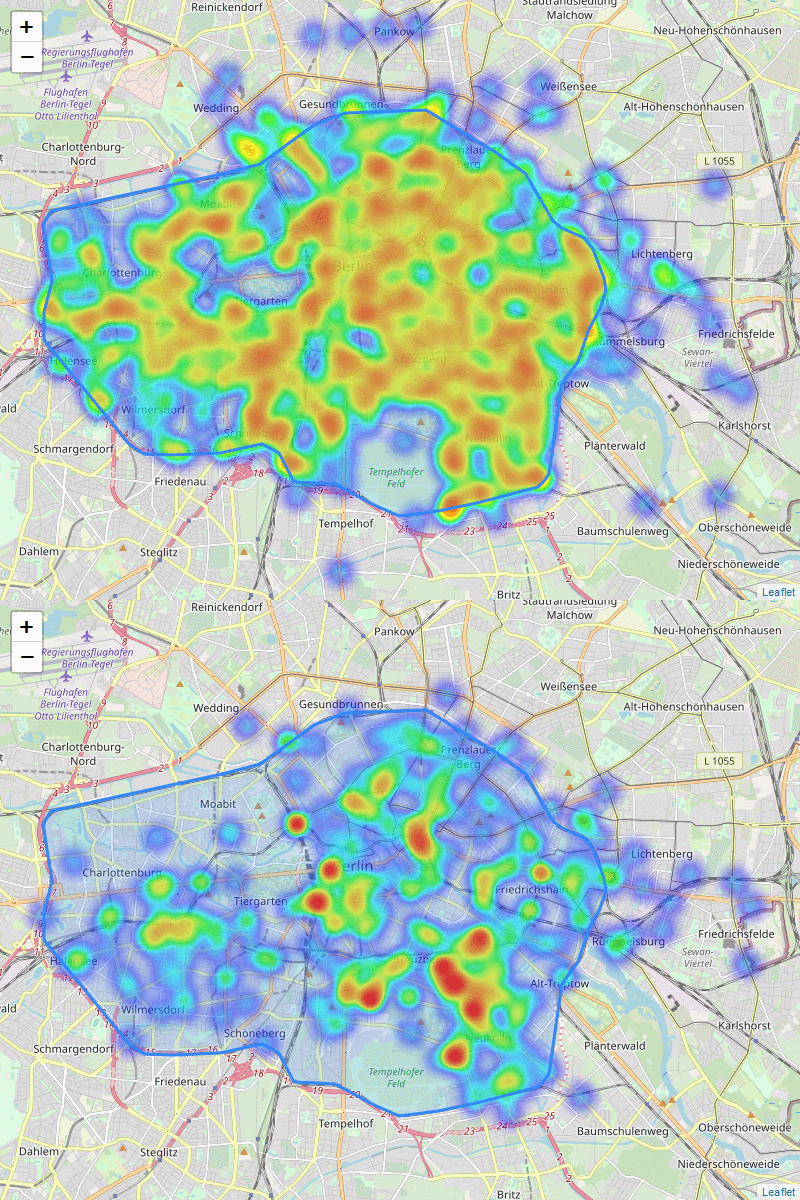
Trips per hour (gif shows only few days)
Analyzed data for Berlin:
- 17 days
- 243 stations
- 2778 bikes
- 9728 trips (raw file of trips: https://github.com/steffmul/nextbike/blob/master/all_trips.csv)
Nextbike offers stations and allows for bikes to be parked inside the flex zone (floating). The starting point of trips stations vs floating bikes. The denser map shows the floating bikes.
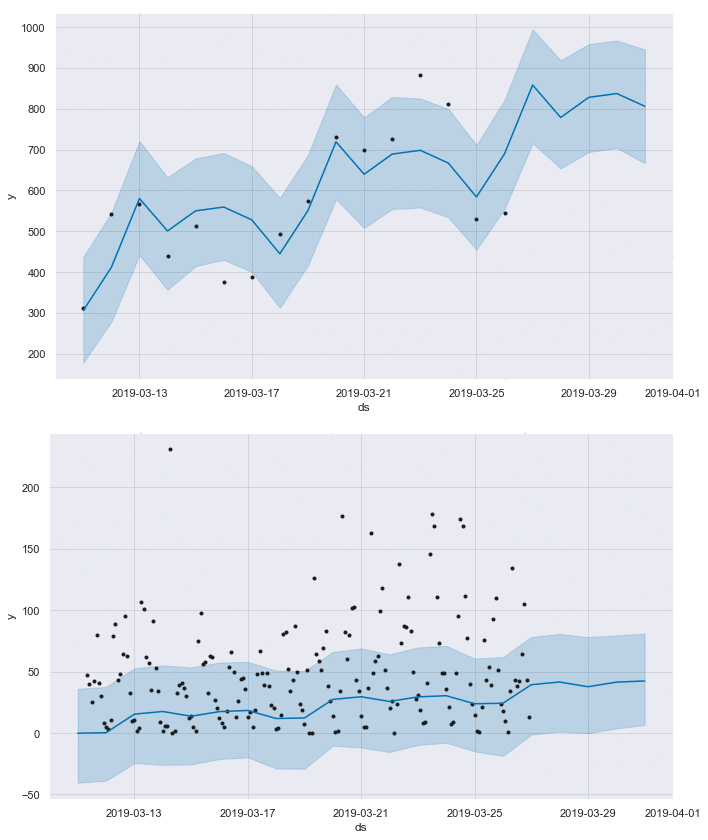
Using FB Prophet to forecast daily or hourly demand
These are the main packages that I have used:
requests==2.21.0
beautifulsoup4==4.7.1
fbprophet==0.4.post2
folium==0.8.3
imageio==2.5.0
matplotlib==3.0.3
numpy==1.16.2
pandas==0.24.2
scipy==1.2.1
seaborn==0.9.0
selenium==3.141.0
This project is licensed under the MIT License - see the LICENSE.md file for details
- Hat tip to anyone whose code was used
- my great teachers at Spiced Academy:
Kristian Rother https://github.com/krother
Paul Pawlodkowski https://github.com/pawlodkowski
Tom Gadsby
- Great thanks for Constantin, who made such an effort to document different APIs https://github.com/ubahnverleih


