Scripts
The main functionality of HoloView are its processing features. Because it is hard or nearly impossible to include the numerous parameters and algorithms the user might want to apply to the captured image, HoloView uses a scripting approach, where the user writes the analysis code himself. However, there will be a standard boilerplate if you are either too lazy or unfamiliar with the python language. In this case: do not worry, it is easy to get started.
Python is a programming language that lets you work quickly and integrate systems more effectively. No really, it is easy to learn for beginners, flexible during daily use and well-supported among the different OS. If you still have not opened a google search for that exciting new thing, have a link: https://www.python.org
Yes, the python standard library is pretty great for most users, but in our case, we need ways to manipulate, analyze and display images. Of course it is possible to write these tools yourself, but for convenience we won't reinvent the wheel today: Some smart python users out there have already written great libraries for our needs. Here is a list with the modules you can use when writing scripts inside HoloView.
| Name | Python module | Description | Link |
|---|---|---|---|
| Numpy | np |
n-dimensional arrays and corresponding manipulation methods | numpy.org |
| Matplotlib |
matplotlib and plt
|
2D plotting library with all kinds of visualization routines | matplotlib.org |
| OpenCV | cv2 |
library for computer vision - plenty algorithms | opencv.org |
| Pillow | PIL |
basic image manipulation routines | python-pillow.org |
Of course, to be abled to output something cool, your little script needs some input as well. The following table lists and explains the variables you can use:
| Name | Purpose |
|---|---|
| img | The image that you previously captured as np.ndarray (2d array of numbers) |
| width | The width of the captured image in pixels |
| height | The height of the captured image in pixels |
| output_vars | A python dict where you can store variables to present |
| output_figs | A python dict for matplotlib figures to be displayed in HoloView
|
figure1 = plt.figure()  # Create new matplotlib figure
plt.imshow(image)

# Output the figure
output_figs["Image 1"] = figure1
And that's basically it! Copy this example into the script editor in HoloView, take a picture and hit that Run button and you're ready to go.
So what happens here? Well, first we create a figure using matplotlibs pyplot submodule. Its syntax might seem familiar to you if you have been working with Matlab or Octave before.
Then, we put the image the script receives inside the figure and output it to a tab called Image 1.
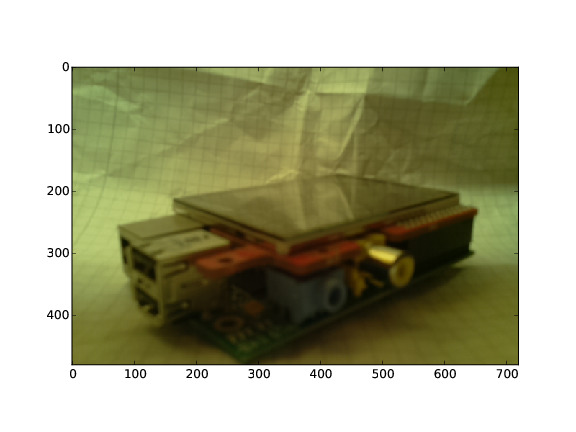
On the right side of the Scripting tab, you'll see a result similar to this:
In this example, we are going to desaturate the image first using OpenCV and putting the gray-version onto another tab.
# Convert the image from the RGB colorspace to a single channel
gray_image = cv2.cvtColor(image, cv2.COLOR_RGB2GRAY)

figure1 = plt.figure()  # Create new matplotlib figure
plt.imshow(image)

figure2 = plt.figure()  # And another figure
plt.imshow(gray_image, cmap='gray')  # Try removing that cmap parameter and watch the colors go crazy!

# Output the figure
output_figs["Color Image"] = figure1
output_figs["Gray Image"] = figure2
This script will produce to output tabs, one with the original image and its grayscale version:
 As you can see, the colors are removed and it's a simple black/white photo.
To show off some more advanced features of the libraries available, we'll find the edges in the next example. Also, we'll get rid of those axes displayed in each output figure.
THRESHOLD_1 = 100                                        # [1]
THRESHOLD_2 = 200
gray_image = cv2.cvtColor(image, cv2.COLOR_RGB2GRAY)     # [2]
edges = cv2.Canny(gray_image, THRESHOLD_1, THRESHOLD_2)  # [3]

output_figs['Edges'] = plt.figure()
plt.imshow(edges, cmap='gray')
plt.axis('off')                                          # [4]
plt.title('Edge Image')                                  # [5]
Now, here are a couple of things to notice: First, the output image does not really look "right". We'll change that later.
Also, there are now two variables defined at the uppermost part of the script: THRESHOLD_1 and THRESHOLD_2 [1]. The Canny-Edge-Algorithm needs those parameters to produce the result, just as our script needs an input image.
It is highly recommended by the authors of this software that you define your variable at the beginning of the script, so they are easy to find if you share your script with other users.
Before the Canny-Algorithm [3] is run, the image is converted to grayscale first [2]. The result-return-part has got two new functions: in [4], we remove the axis we had in previous examples, and [5] gives the figure a title.