Skip to content

strawlab/strawlab-examples

Repository files navigation

Strawlab time series analysis example

These are some simple analysis examples over an open time series dataset from the strawlab. They support our EuroScipy 2015 talk Reverse Engineering Animal Vision with Virtual Reality:

Link to the youtube video of the presentation.

Usage

We recommend installing using the provided conda environment:

# Clone the repository
git clone https://github.com/strawlab/strawlab-examples.git
# Create the conda environment
cd strawlab-examples
conda create -n strawlab -f environment.yaml
# Activate the environment
source activate strawlab
# Run an example analysis script
python strawlab_examples/euroscipy/euroscipy_example.py

The last step runs strawlab_examples/euroscipy/euroscipy_example.py. This simple script will download a sample dataset of trials. A trial is a collection of time series keeping track of stimuli and measuring response for a single fly flight with rich metadata (e.g. genotype, type of stimulus, time...) attached. It will then proceed to perform some analysis leveraging, among others, whatami and jagged. In particular, the script will:

  • store data and results in ~/np-degradation
  • download the dataset if needed (1.7GB)
  • generate a jagged store for fast retrieval of single trial time series
  • generate a features table with several response only and stimulus-response features per trial
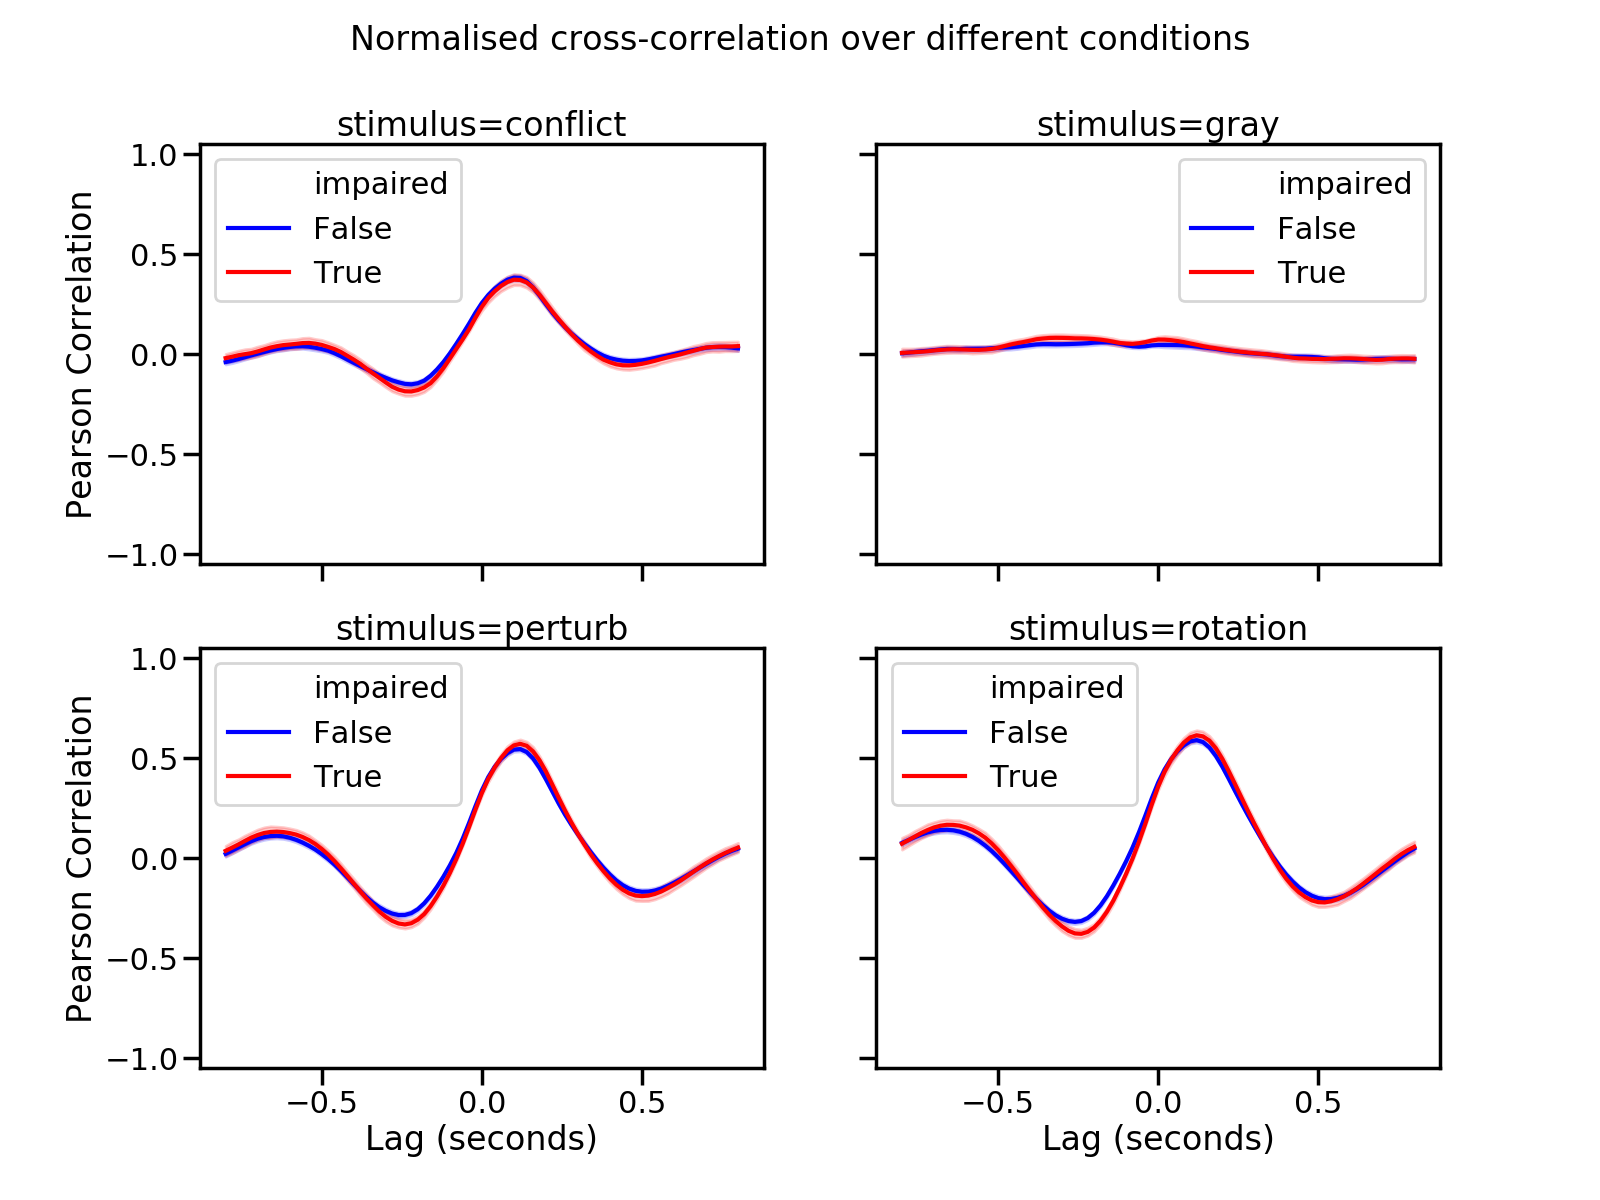
  • melt the features dataframe for easy analysis of stimulus-response correlation at several lags

If all goes well, the following plot will be generated:

Cross-correlation of animal turning rate vs stimulus rotational speed, comparing flies with impaired neuropeptide function vs non-impaired (control). When the stimulus is invisible to the fly (stimulus=gray), no correlation is observed, which is to be expected. For the other three stimuli we can observe two main bumps in correlation: one a bit before lag 0 (corresponding to the stumuli "reacting" to the fly) and one after 0 (corresponding to the fly reacting to the stimuli). The magnitude of the peak correlation is lower in the stimulus=conflict condition, which is also to be expected as the fly is "distracted" by a virtual post - that is, the fly is "conflicted" between its so called "optomotor response", its innate tendency to correct correct course, and its so called "fixation" response, its tendency to fly towards certain objects.

Cross-correlation of animal turning rate vs stimulus rotational speed, comparing flies with impaired neuropeptide function vs non-impaired (control). When the stimulus is invisible to the fly (stimulus=gray), no correlation is observed, which is to be expected. For the other three stimuli we can observe two main bumps in correlation: one a bit before lag 0 (corresponding to the stumuli "reacting" to the fly) and one after 0 (corresponding to the fly reacting to the stimuli). The magnitude of the peak correlation is lower in the stimulus=conflict condition, which is also to be expected as the fly is "distracted" by a virtual post - that is, the fly is "conflicted" between its so called "optomotor response", its innate tendency to correct correct course, and its so called "fixation" response, its tendency to fly towards certain objects.

Benchmark

Note that for running the full benchmarks you would need datasets that are unreleased yet. Use the public neuropeptide degradation dataset to get a feeling on how these work:

Dataset of 3D fly (Drosophila melanogaster) flight trajectories to study the role of neuropeptide degradation in visuo-motor behaviors.

Note: the benchmark code has moved to the jagged_ repository.

About

Some data analysis examples from the Straw lab (http://www.strawlab.org)

Resources

License

Stars

Watchers

Forks

Releases

No releases published

Packages

No packages published

Languages