Keep state of plotly charts on browser window resize #6324
Comments
|
Hi @sebwills 👋 Thank you for submitting this issue! IMO this is not a bug in In your example, assign import pandas as pd
import plotly.express as px
import streamlit as st
st.set_page_config(
layout="wide"
) # Not required, but makes bug more obvious, since every resize then affects the plot
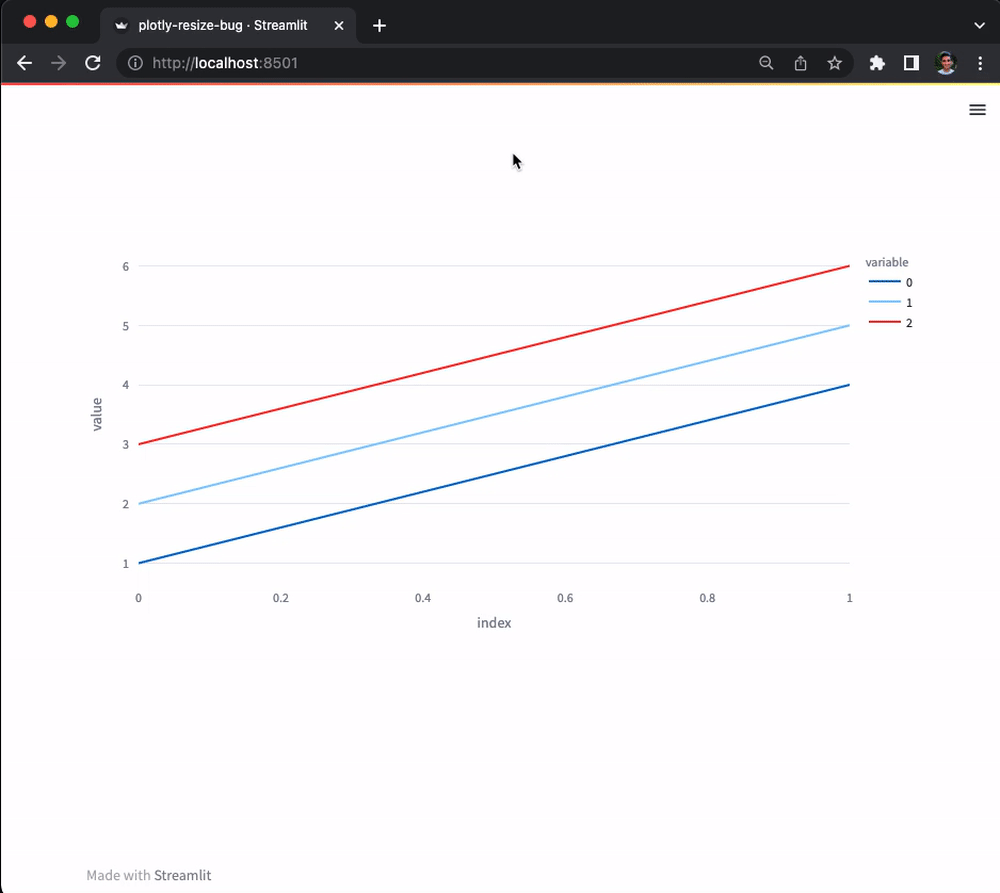
df = pd.DataFrame([[1, 2, 3], [4, 5, 6]])
fig = px.line(df)
fig.update_layout({"uirevision": "foo"}, overwrite=True)
st.plotly_chart(fig, use_container_width=True) # Makes bug more obvious
Source: https://discuss.streamlit.io/t/cant-enter-values-without-updating-a-plotly-figure/28066/2 |
|
Thanks @snehankekre for investigating! I'm relabeling this as enhancement since I believe we could potentially also make this work out of the box in Streamlit (e.g. automatically setting the |
|
Good call, Lukas! I'll add the |
|
Thank you both! I confirm adding the suggested code works around the issue. I do feel that this is unexpected behavior and as such it would make sense to incorporate the workaround into streamlit (automatically, not just in the docs) if you can. I can see it could make sense to reset the chart if the data it is plotting changes, but I can't imagine anyone would want or expect it to reset when you resize the browser. |
Checklist
Summary
If a user interacts with a plotly line chart in a streamlit dash (for example, zooming in, or hiding some series), then resizes the browser window (in a way that affects the rendering of the chart), the chart returns to its initial state.
Reproducible Code Example
Steps To Reproduce
Expected Behavior
Resizing the browser window should not undo changes made to the state of the plotly chart.
Current Behavior
Resizing the browser window undoes changes made interactively to the state of the plotly chart, returning it to default zoom, selected series, etc.
Is this a regression?
Debug info
Additional Information
No response
Are you willing to submit a PR?
The text was updated successfully, but these errors were encountered: