A LeafletJS plugin for displaying geoTIFF raster data from a Web Coverage Service. This plugin extends Leaflet.NonTiledLayer.
DEMO The displayed data may take a few seconds to download.
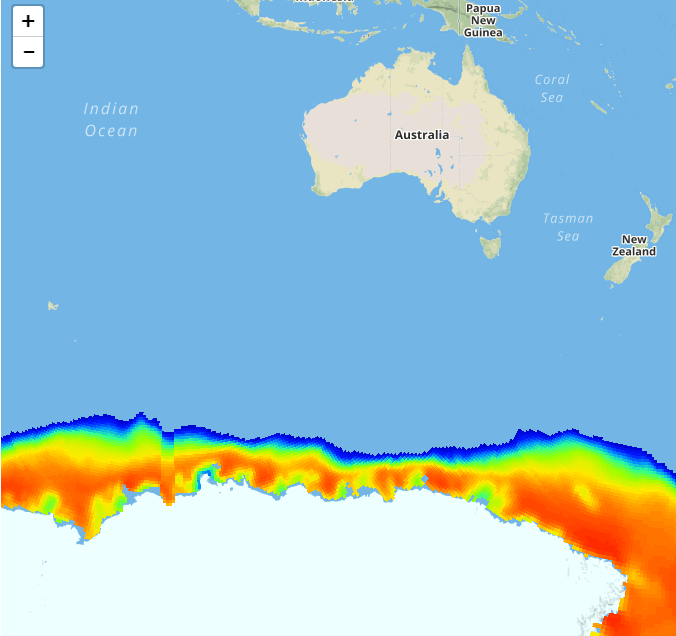
Sea ice coverage in the Southern Ocean.
This plugin uses geotiff.js and plotty.
- Include the JavaScript file and dependencies:
    <script src="https://npmcdn.com/leaflet@1.0.3/dist/leaflet.js"></script>
    <script src="https://unpkg.com/leaflet.nontiledlayer/dist/NonTiledLayer.js"></script>
    <script src="vendor/geotiff.js"></script>
    <script src="vendor/plotty.js"></script>
<script src="leaflet-geotiff.js"></script>- Add a WCS layer
L.nonTiledLayer.wcs(url,options)
url- WCS url, e.g.https://domain.org/cgi-bin/server_path?options:wcsOptions: an object containing options for the WCS query, e.g.{version: '1.0.0',}displayMin,displayMax- Minimum and maximum values to plot.clampLow,clampHigh- (optional, default = true) If true values outsidedisplayMintodisplayMaxwill be rendered as if they were valid values.band- (optional, default = 0) geoTIFF band to read.image- (optional, default = 0) geoTIFF image to read.colorScale- (optional, default = "rainbow"). Plotty color scale used to render the image.useCanvas- (optional). If available use a canvas element to render the images
-
Because WCS servers can be slow to respond, the layer fires a
wcsloadingevent when data is requested andwcsloadedwhen the data arrives. -
Data values can be extracted using the
getValueAtPoint(e.containerPoint)method. -
New color scales can be created using plotty's addColorScale method.
- Leaflet.NonTiledLayer.WCS works with Leaflet 0.7.7 and >=1.0
- Requires: