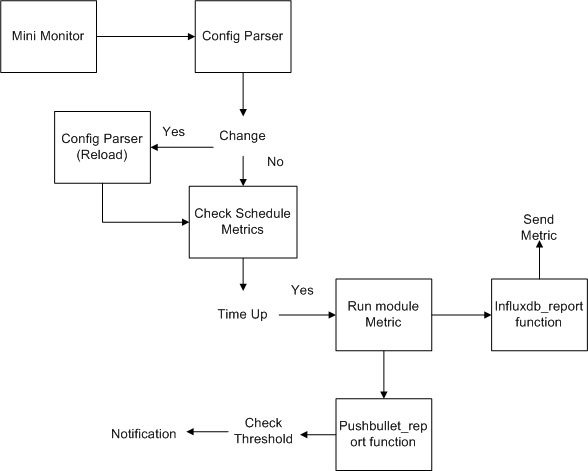
This is a mini monitor tool for monitor custom metric from container, and should be start inside container when spawned. It will get custom metric for alarm via pushbullet and send data to influxdb for graphing. We can write your own module to get custom metric from container, and this tool will help us monitor base on pre-define metric threshold, and push data for graphing.
- Disadvantage: working locally, container name is still not flexible.
- In Development: support etcd for central configuration, support namespace in control container_name, active in manage create/delete down/useless container from docker cluster like kubernetes/docker swarm ....
Note:
- Update Influxdb server information
- Update pushbullet api
Your metric data from your module can be: string, float, int (10MB, 1000, 20%, 7.2 etc..)
suker-hostname=suker01,region=hcm,env=production-email:tan.luong@gmail.com,suker200@gmail.com-ccu:warning=10,critical=300,time=15
Clarify :
- suker (container name)
- hostname=suker01,region=hcm,env=production (format your column when graphing)
- email (for send notification)
- ccu:warning=10,critical=300,time=15 (ccu : metric, warning-critical : threshold, time: interval schedule check)
- Your import block : input two modules : Config parser + Data report
- Your Function input:
-
func Ccu(os string, function string, object_config map[string]map[string]interface{}, object_tag config_parser.Server, messages chan string): this is your function name with default input we should use -
os: we try to detect your os, you can use or not. No issue
-
function: this is metric name we define in config.cnf, Note: metric_name = function_name for us easy and flexible using
-
object_config: all your config from config.cnf will be parse and put here
map[ccu:map[time:15 warning:10 critical:300] loadavg:map[warning:10 critical:20 time:10]- object_tag: this is hostname=suker01,region=hcm,env=production
- messages: we use goroutine
-
Your Function body:
-
Prepare data for graphing: example loadavg we have 3 value: 1min, 5mins, 15mins, generate 3 string and append with \n delimiter
loadavg := "loadavg" + "," + object_tag.Tag + "," + "type=loadavg1min" + " value=" + loadavg1min + "\n" loadavg += "loadavg" + "," + object_tag.Tag + "," + "type=loadavg5min" + " value=" + loadavg5min + "\n" loadavg += "loadavg" + "," + object_tag.Tag + "," + "type=loadavg15min" + " value=" + loadavg15min + "\n" -
3 values will be sub data of column "loadavg" when graphing in influxdb + grafana
-
Note: this loadavg value will return for graphing by return to messages: messages <- loadavg
-
Take notification: call pushbullet function with some default variable
- data_report.Pushbullet_report(function, object_config, "LoadAvg1Min", loadavg1min)
- Clarify:
- function, object_config: from Function input
- LoadAvg1Min: this will be title of message alarm
- loadavg1min: value for check threshold
-
-
Edit
main_go.go:- Put your function like here for map function, key is
metric_name = function_namemap_function := map[string]interface{}{ "memory": data_parser.Memory, "ccu": data_parser.Ccu, "loadavg": data_parser.LoadAvg, "disk": data_parser.Disk, "cpuusage": data_parser.GetCPUUsage } - Put your path module to import block of
main_go.go
- Put your function like here for map function, key is
-
- Example: This Dockerfile will build container run nginx and copy binary to container and run all services by init.sh script
- Note: In case container image does not have "ceritificate: x509: failed to load system roots and no roots provided" --> install certificate package by install : ca-certificates (ubuntu, alpine image), if not, notification send to https protocol will be failed.
- Using: Dockerfile and init.sh in repo for example.
- Note: We have still using "fmt" to print out data, we can check for working status by using
docker logs <container_name>. Aboutconfig.cnf, we can using-voption for changing config, binary will auto reload when there has change in config file. Beside that, for easy control, config for all container can put to one file and sync to all host.