StatsD is a simple network daemon that continuously receives metrics over UDP and periodically sends aggregate metrics to upstream services like (but not limited to) Graphite. Because it uses UDP, sending metrics data to StatsD is very fast with little to no overhead.
Kamon statsd module is currently available for Scala 2.10, 2.11 and 2.12.
Supported releases and dependencies are shown below.
| kamon-statsd | status | jdk | scala | akka |
|---|---|---|---|---|
| 0.6.7 | stable | 1.7+, 1.8+ | 2.10, 2.11, 2.12 | 2.3.x, 2.4.x |
To get started with SBT, simply add the following to your build.sbt
file:
libraryDependencies += "io.kamon" %% "kamon-statsd" % "0.6.7"At the very basic level, you will certainly want to use the kamon.statsd.hostname and kamon.statsd.port configuration
keys to ensure your data is being sent to wherever your StatsD instance is running. Additionally to that, you can configure
the metric categories to which this module will subscribe using the kamon.statsd.subscriptions key. By default, the
following subscriptions are included:
kamon.statsd {
  subscriptions {
    histogram       = [ "**" ]
    min-max-counter = [ "**" ]
    gauge           = [ "**" ]
    counter         = [ "**" ]
    trace           = [ "**" ]
    trace-segment   = [ "**" ]
    akka-actor      = [ "**" ]
    akka-dispatcher = [ "**" ]
    akka-router     = [ "**" ]
    system-metric   = [ "**" ]
    http-server     = [ "**" ]
  }
}
If you are interested in reporting additional entities to StatsD please ensure that you include the categories and name patterns accordingly.
By default, the kamon-statsd module will use the entities' information to create a predictable metric key that follows
the pattern application.host.category.entity-name.metric-name, where each portion of the pattern corresponds to:
- application: Uses the value of the
kamon.statsd.simple-metric-key-generator.applicationconfiguration key. Defaults tokamon. - host: Uses the local host name. You can also change the host value to a arbitrary value using the
kamon.statsd.simple-metric-key-generator.hostname-overrideconfiguration key or completely remove the host portion from the key pattern by changing thekamon.statsd.simple-metric-key-generator.include-hostnameconfiguration key. - category: The entity's category.
- entity-name: The entity's name.
- metric-name: The metric name assigned in the entity recorder.
This metric key generation mechanism seems very useful and flexible, but in case it falls short for your needs then you
can create your own implementation of kamon.statsd.MetricKeyGenerator and let Kamon know about it by setting the
kamon.statsd.metric-key-generator configuration key to the FQCN of your implementation.
kamon-statsd module allows you to control the way data is flushed to StatsD server. By default Kamon is shipped with two diferent senders:
kamon.statsd.BatchStatsDMetricsSenderwhich batches data and sends a UDP packet everykamon.statsd.flush-intervalor as soon askamon.statsd.batch-metric-sender.max-packet-sizeis reached. It is advisable to experiment with both of these settings to find the right balance between network bandwidth utilization and granularity on your metrics data. This sender is used by default.kamon.statsd.SimpleStatsDMetricsSenderwhich sends a UDP packet for each piece of data it receives.
One can choose one over another changing kamon.statsd.metric-sender-factory configuration key to kamon.statsd.BatchStatsDMetricsSender or kamon.statsd.SimpleStatsDMetricsSender respectively. Also custom senders can be pluged-in this way. The value for kamon.statsd.metric-sender-factory should represent a FQCN for a Scala object that implements kamon.statsd.StatsDMetricsSenderFactory interface.
Kamon keeps all timing measurements in nanoseconds and memory measurements in bytes. In order to scale those to other units before sending to StatsD, set time-units and memory-units config keys to desired units. Supported units are:
n  - nanoseconds
µs - microseconds
ms - milliseconds
s  - seconds

b  - bytes
kb - kilobytes
mb - megabytes
gb - gigabytes
For example,
kamon.statsd.time-units = "ms"
will scale all timing measurements to milliseconds right before sending to StatsD.
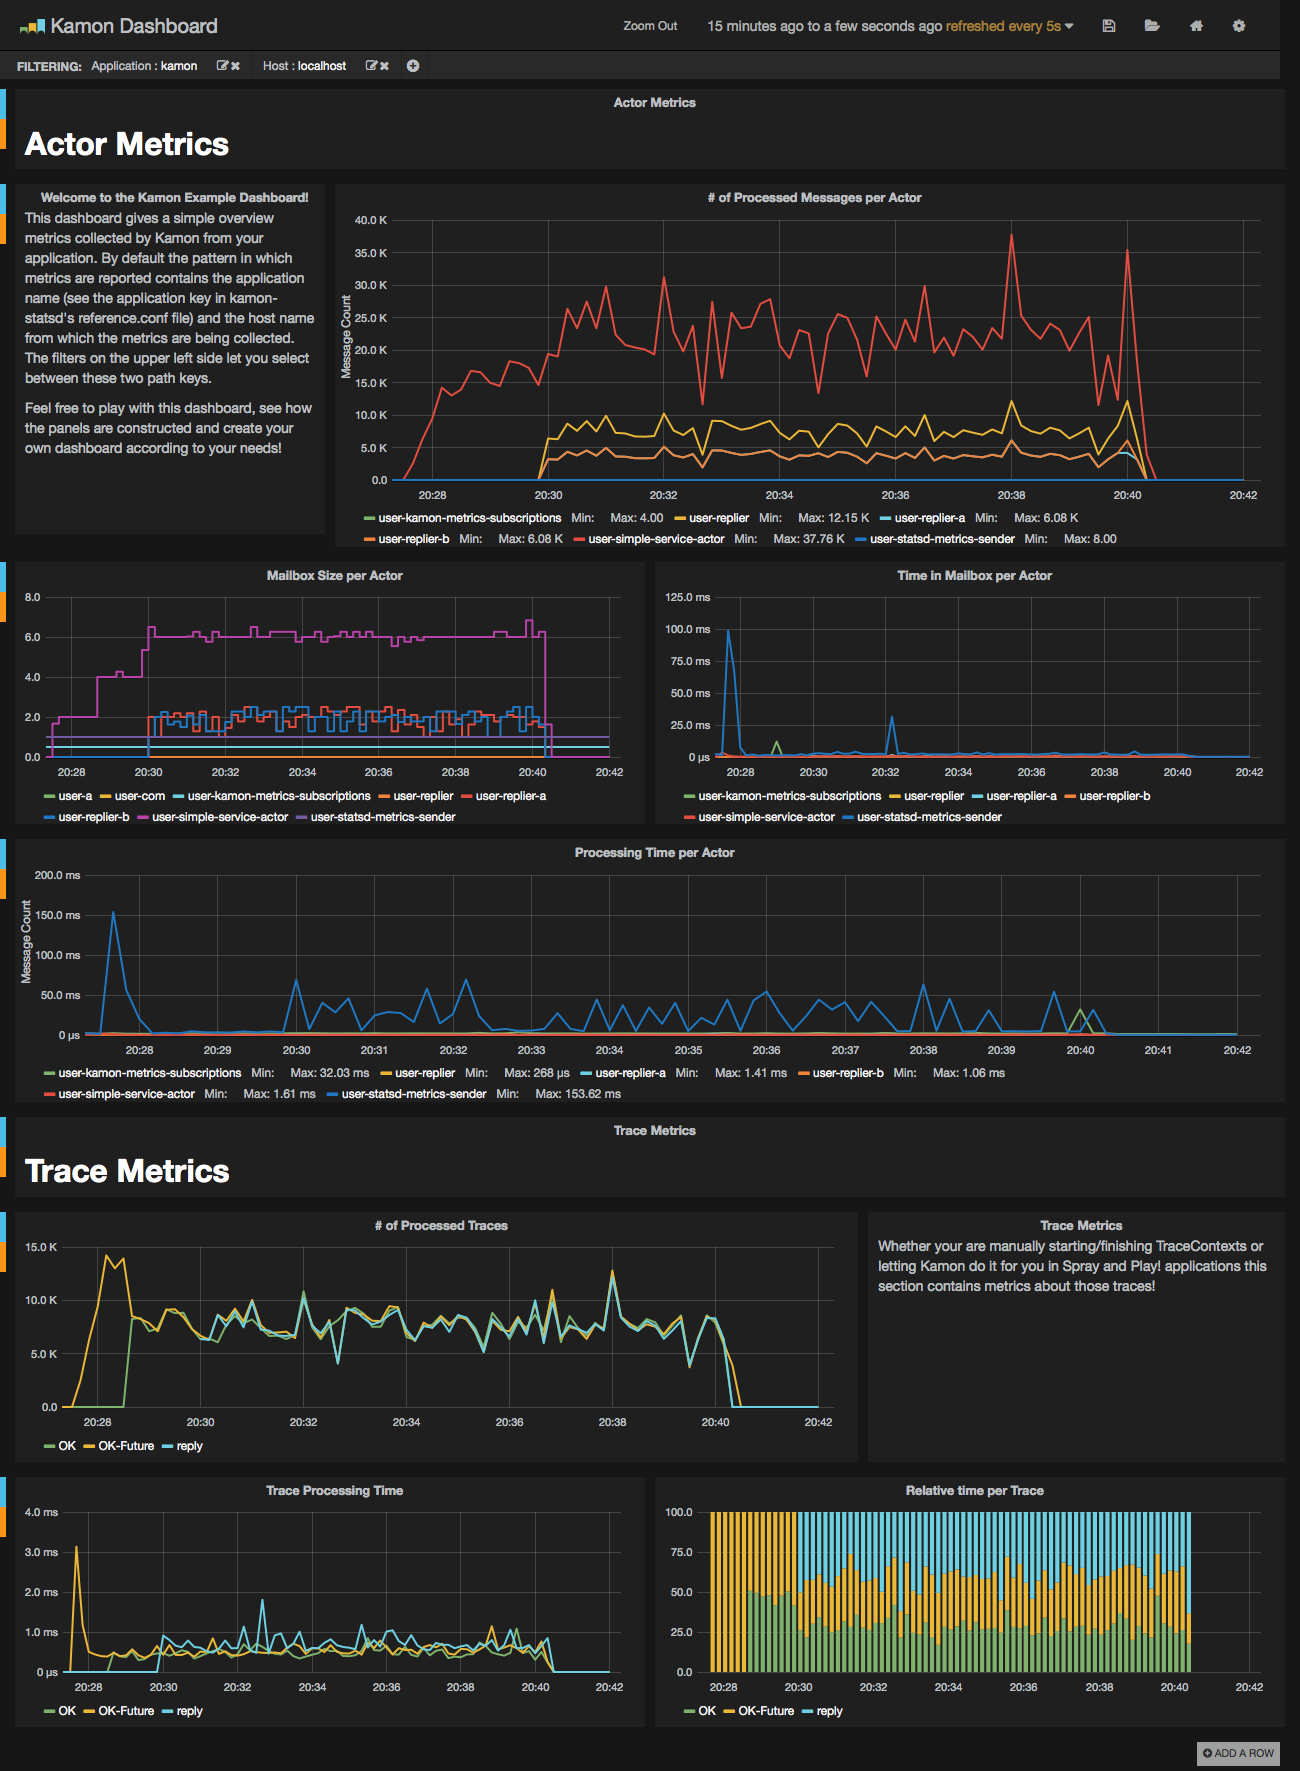
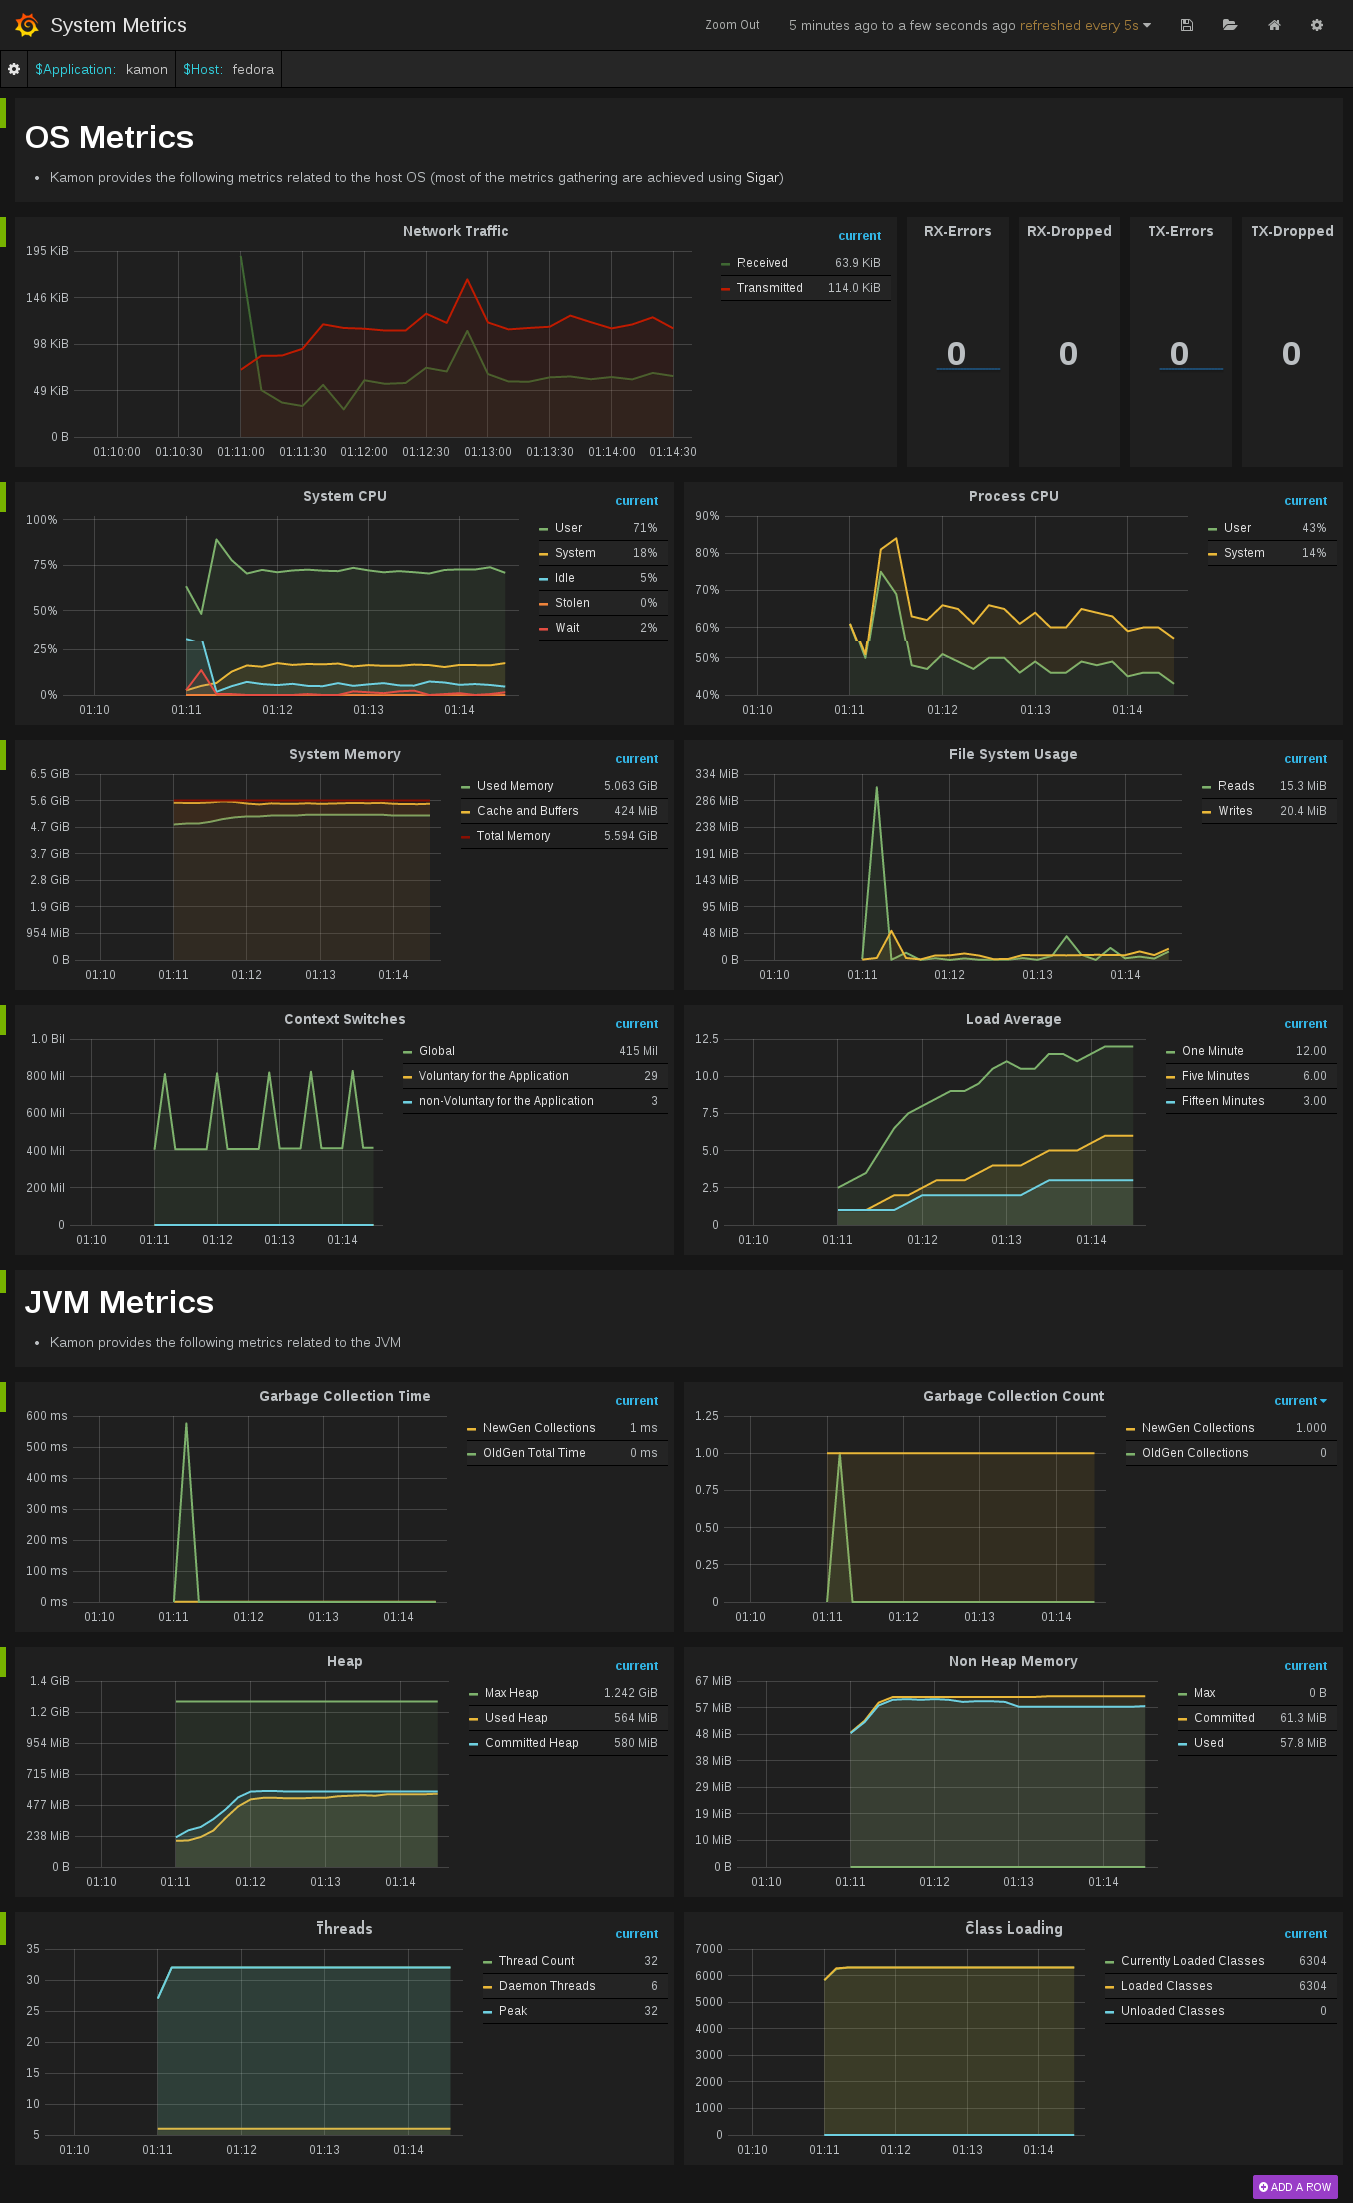
StatsD is widely used and there are many integrations available, even alternative implementations that can receive UDP messages with the StatsD protocol, you just have to pick the option that best suits you. For our internal testing we choose to use Graphite as the StatsD backend and Grafana to create beautiful dashboards with very useful metrics. Have an idea of how your metrics data might look like in Grafana with the screenshot bellow or use our docker image to get up and running in a few minutes and see it with your own metrics!