Code to calculate network measures for multi-regional input-output (MRIO) tables as used on http://zeean.net/visualization
The Betweenness Centrality reflects a country’s importance within the global supply network considering two factors: its connectivity to other regions and the amount of products (measured in US
Algorithm based on: Brandes, U. (2001). A faster algorithm for betweenness centrality. The Journal of Mathematical Sociology, 25(2), 163-177.
The "Flow Centrality" we use here measures the number of maximum through-flow paths in the network of regional sectors passing through each of the regional sectors. A through-flow path between two regional sectors is a path connecting these two network nodes via flows associated with the minimum of all flows along that path. The through-flow paths associated with the maximal value of all these paths are maximum through-flow paths between those two nodes. The Flow Centrality is thus similar to the Betweenness Centrality but unlike the latter takes the size of flows into account.
Algorithm is also based on: Brandes, U. (2001). A faster algorithm for betweenness centrality. The Journal of Mathematical Sociology, 25(2), 163-177.
The Global Adaptive Pressure (GAP) reflects a country’s importance within the global supply network. It measures how dependent all other regions are on direct (1st order) and indirect (2nd order) supplies from this country.
The value of GAP provides the percentage production failure of the total production of a country due to the direct or indirect effects of a complete production failure in the selected country (1=100%). GAP is thereby an upper limit of the direct or indirect influence mainly because it assumes that the supply failure is not compensated by enhanced supply from other regions and because it assumes perfect complementarity of the production process.
More specific its definition is, for 0th order (let U be the set of forced regional sectors, e.g. in zeean all regional sectors in a chosen region):

Then the k-th order is defined recursively as:
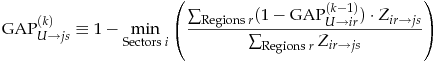
And for a "target" region r:
