
ggplot2 has become the standard of plotting in R for many users. New users, however, may find the learning curve steep at first, and more experienced users may find it challenging to keep track of all the options (especially in the theme!).
ggedit is a package that helps users bridge the gap between making a plot and getting all of those pesky plot aesthetics just right, all while keeping everything portable for further research and collaboration.
ggedit is powered by a Shiny gadget where the user inputs a ggplot plot object or a list of ggplot objects. You can run ggedit directly from the console from the Addin menu within RStudio.
Short clip from rstudio::conf 2017 (13:40-19:40)

User Lightning Talks – RStudio
install.packages('ggedit')devtools::install_github("metrumresearchgroup/ggedit")- layers
- non colour aesthetics of numeric inputs are not currently supported, e.g.:
iris%>%ggplot(aes(x=Sepal.Length,y=Sepal.Width))+geom_point()+geom_text(aes(label=Species,size=Sepal.Length)) - geom_text: family is not currently open to change
- non colour aesthetics of numeric inputs are not currently supported, e.g.:
- theme
- margin,arrow are not currently available to edit
use ggedit as part of any Shiny application full post

If you have ggedit installed then you can run an example of the module in an app:
runApp(system.file('examples/shinyModule.R',package = 'ggedit'))
generalized ggsave to save multiple outputs of ggplot to single file and multiple files from a single call. Plots can be saved to various graphic devices.
library(ggedit)
#single file output to pdf
gggsave('Rplots.pdf',plot=pList)

#multiple file output to pdf
gggsave('Rplots.pdf',plot=pList,onefile=F)

#multiple file output to png
gggsave('Rplots.png',plot=pList)
A new argument has been added to the ggedit call. If verbose is set to true on the ggedit call then for the:
- Layer output: In addition to the new ggproto object the user will also get the ggplot script that can be parsed/pasted in the console to create the same layer.
- Theme output: In addition to the new theme object the user will also get the ggplot script that can be parsed/pasted in the console to create the same theme.
- Scale output: In addition to the new scale object the user will also get the ggplot script that can be parsed/pasted in the console to create the same scale.
During the editing users are able to see in real time the updates to the verbose scripts of the layers in a shinyAce window above the plot. They can copy the script directly to their clipboard to use in further analysis.

If the colour/fill aestheteic is continous the user has two options to set the pallete
- choose from a list of predefined palletes that are used in
scale_*_grandientn()
  c('Blues', 'BuGn', 'BuPu', 'GnBu', 'Greens', 'Greys', 'Oranges',
  'OrRd', 'PuBu', 'PuBuGn', 'PuRd', 'Purples', 'RdPu', 'Reds',
'YlGn', 'YlGnBu', 'YlOrBr', 'YlOrRd')- choose the manual option and a tandem of colourpicker widgets appear under the selectize list. The left one for the low colour and the right one for the high colour in a
scale_*_gradient(). See here for an example image.
Removed from package in Miscellaneous/Utilities
plot.theme(): S3 Method that plots the contents of a ggplot theme object (using ggplot2 graphics). The output highlights what theme elements are currently active example output. If the user gives two themes (compare and base) it will return a comparison of the two showing what has changed from the theme defined as base example output.
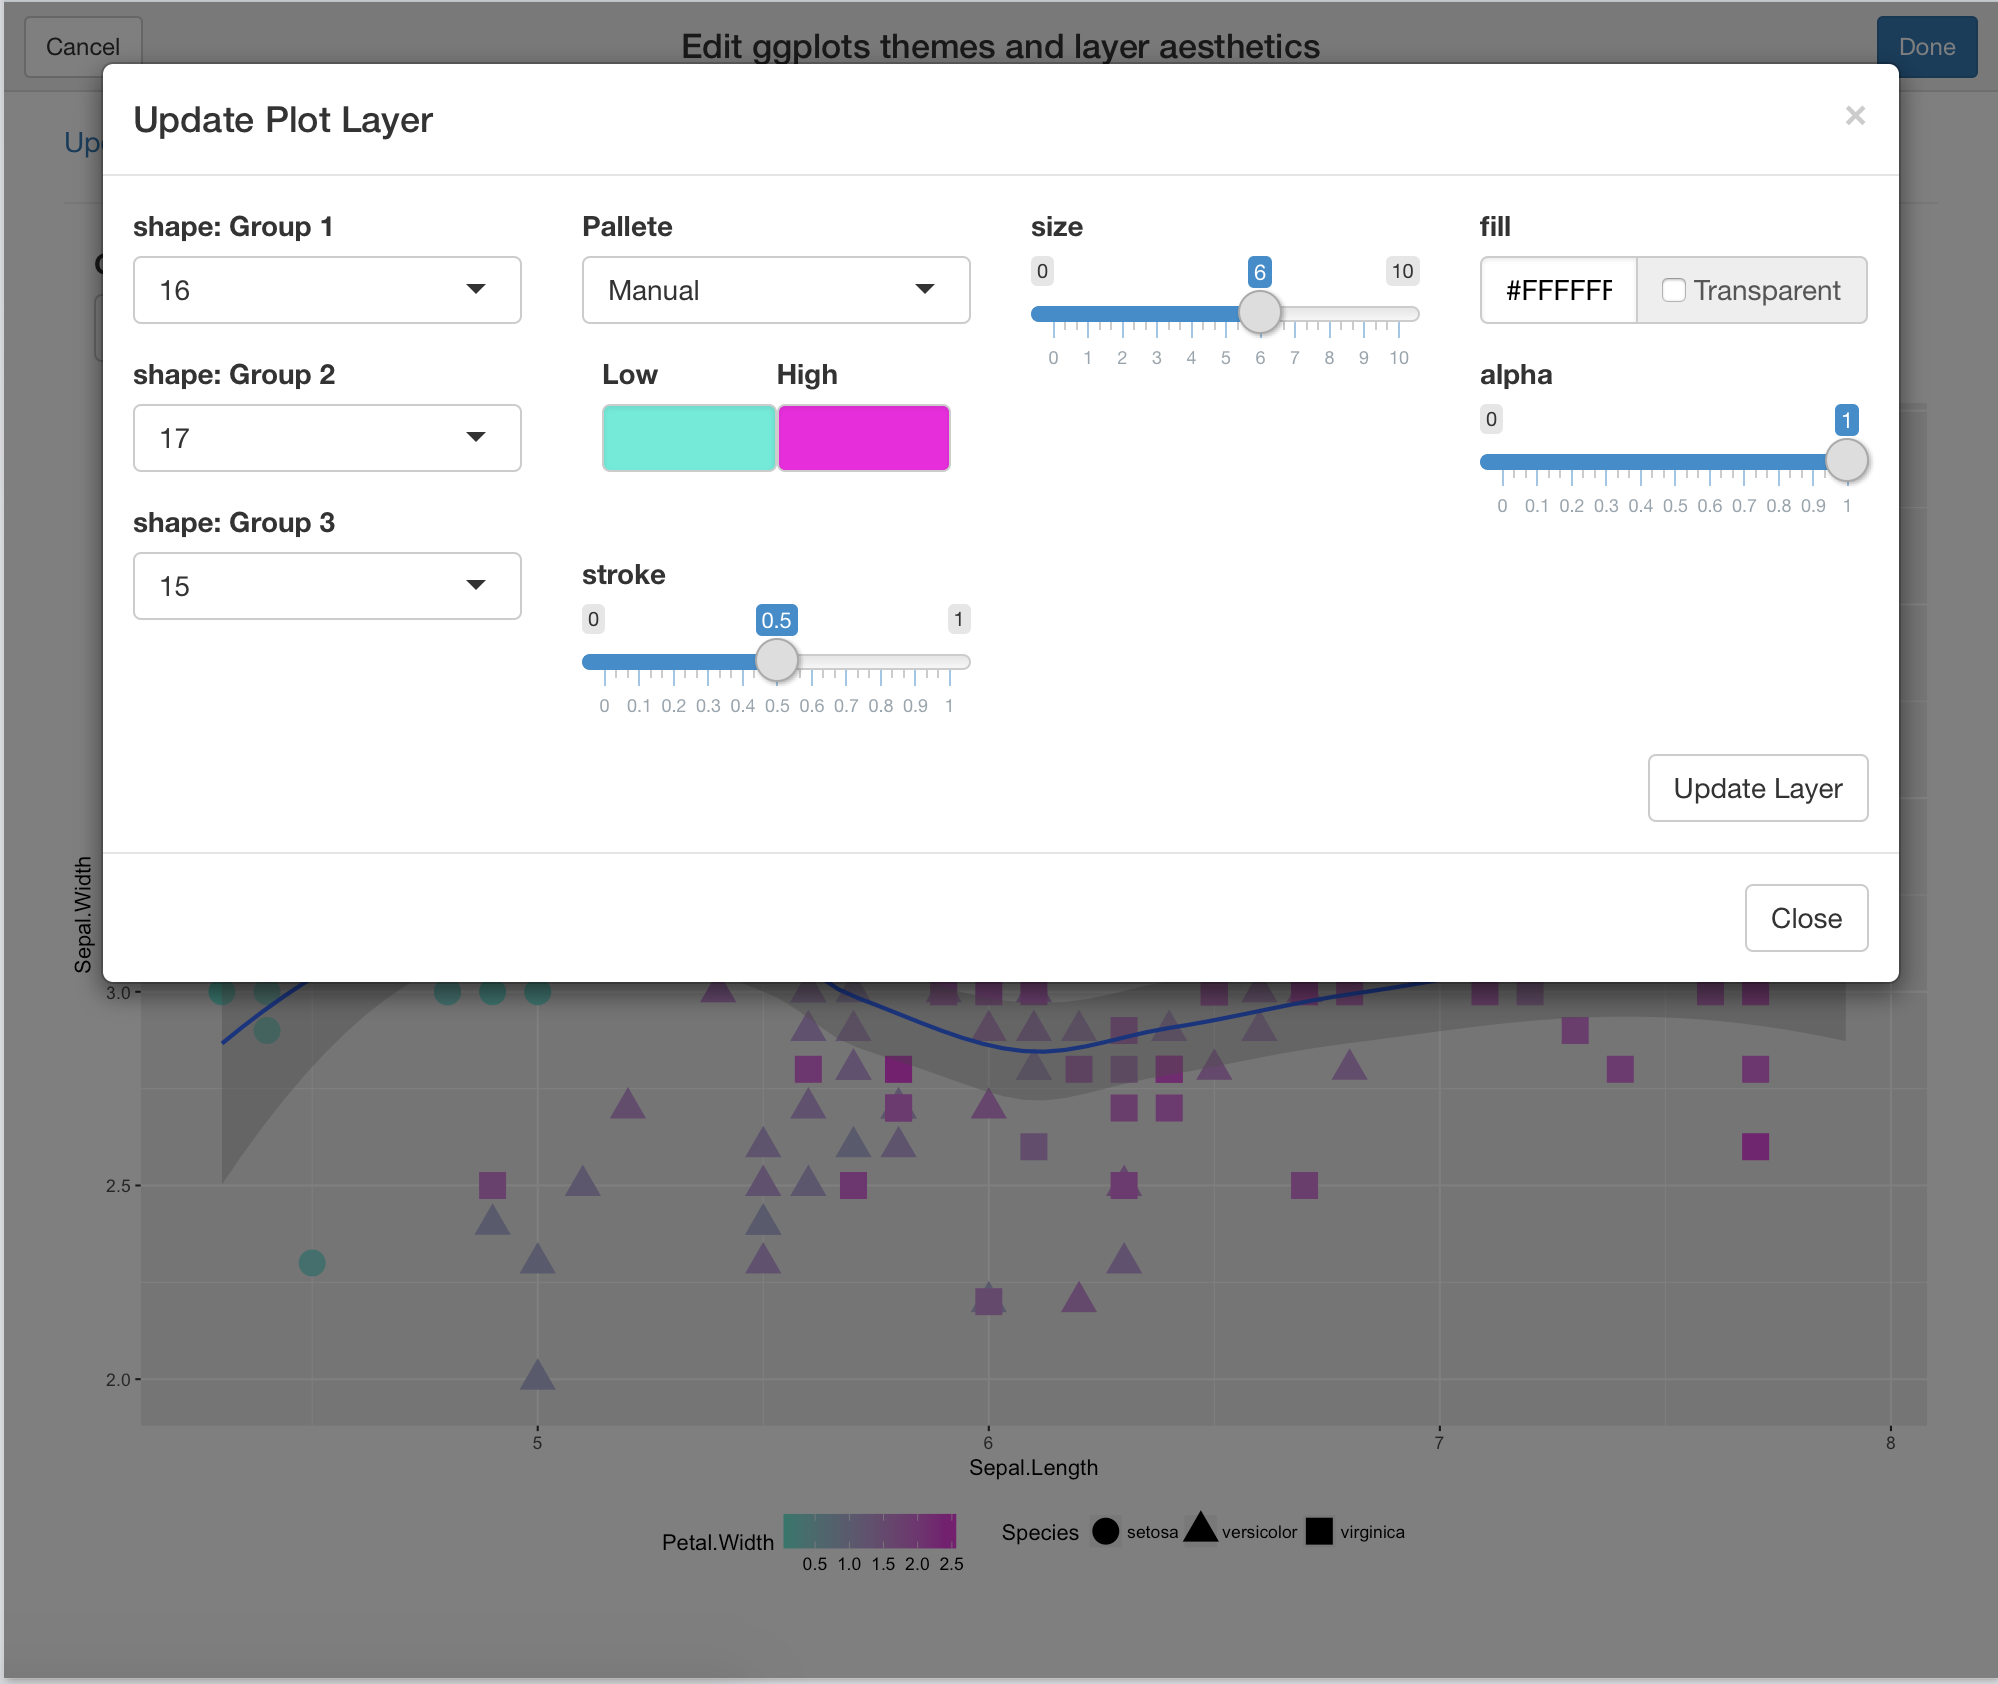
The gadget creates a popup window which is populated by the information found in each layer. You can edit the aesthetic values found in a layer and see the changes happen in real time.

You can edit the aesthetic layers while still preserving the original plot, because the changed layers are cloned from the original plot object and are independent of it. The edited layers are provided in the output as objects, so you can use the layers independent of the plot using regular ggplot2 grammar. This is a great advantage when collaborating with other people, where you can send a plot to team members to edit the layers aesthetics and they can send you back just the new layers for you to implement them.
ggedit also has a theme editor inside. You can edit any element in the theme and see the changes in real time, making the trial and error process quick and easy. Once you are satisfied with the edited theme you can apply it to other plots in the plot list with one click or even make it the session theme regardless of the gadget. As with layers, the new theme object is part of the output, making collaboration easy.

The gadget returns a list containing 4 elements
- updatedPlots
- List containing updated ggplot objects
- updatedLayers
- For each plot a list of updated layers (ggproto) objects
- Portable object
- updatedLayersElements
- For each plot a list elements and their values in each layer
- Can be used to update the new values in the original code
- UpdatedLayerCalls
- For each plot a list of scripts that can be run directly from the console to create a layer
- updatedThemes
- For each plot a list of updated theme objects
- Portable object
- If the user doesn't edit the theme updatedThemes will not be returned
- UpdatedThemeCalls
- For each plot a list of scripts that can be run directly from the console to create a theme
After you finish editing the plots the natural progression is to use them in the rest of the script. In ggedit there is the function rgg (remove and replace ggplot). Using this function you can chain into the original code changes to the plot without multiplying script needlessly.

With this function you can
Specify which layer you want to remove from a plot:
ggObj%>%rgg('line')
Provide an index to a specific layer, in instances where there are more than one layer of the same type in the plot
ggObj%>%rgg('line',2)
Remove a layer from ggObj and replace it with a new one from the ggedit output p.out
ggObj%>%rgg('line',newLayer = p.out$UpdatedLayers)
Remove a layer and replace it with a new one and the new theme
ggObj%>%rgg('line',newLayer = p.out$UpdatedLayers)+p.out$UpdatedThemes
There is also a plotting function for ggedit objects that creates a grid.view for you and finds the best grid size for the amount of plots you have in the list. And for the exotic layouts you can give specific positions and the rest will be done for you. If you didn't use ggedit, you can still add the class to any ggplot and use the plotting function just the same.
plot(as.ggedit(list(p0,p1,p2,p3)),list(list(rows=1,cols=1:3),
                                       list(rows=2,cols=2),
                                       list(rows=2,cols=1),
                                       list(rows=2,cols=3))
)To launch the Shiny gadget from the addin menu highlight the code that creates the plot object or the plot name in the source pane of Rstudio, then click on the ggedit addin from the Addins the dropdown menu.
