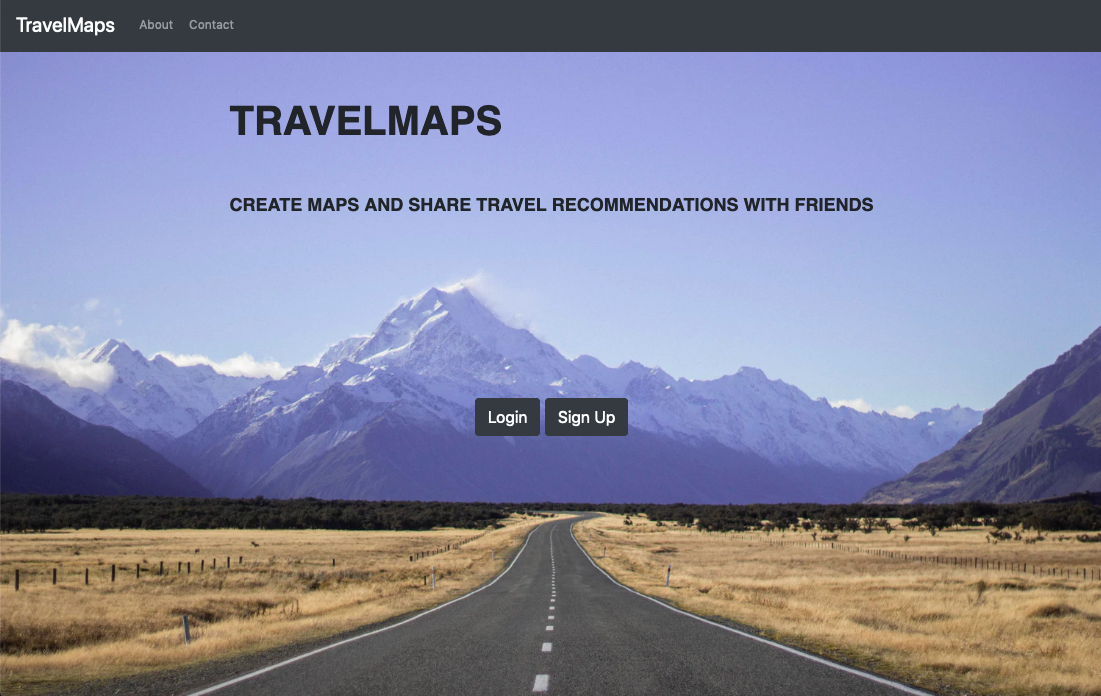
TravelMaps is a full stack web application that allows users to share travel recommendations and itineraries.
TravelMaps has a custom web interface that allows users to create dynamic maps with pointers to recommended places and add place-specific notes. Users can share a dynamic, read-only version their maps using a shareable link containing a unique identifier. An internal dashboard gathers data about trends across all users, such as popular travel destinations and recommended places, and displays the data on two charts and a heat map. The application has 94% test coverage using Python unittest.
This project was made at Hackbright Academy in San Francisco over four weeks in November 2019.
Tech Stack: Python, JavaScript, HTML, CSS, Flask, Jinja, jQuery, AJAX, PostgreSQL, SQLAlchemy, Bootstrap, chart.js, unittest
APIs: Google Maps JavaScript, Google Maps Places
You must have the following installed to run TravelMaps:
- PostgreSQL
- Python 3.x
- API key for Google Maps JavaScript and Google Maps Places APIs
Clone or fork repository:
$ git clone https://github.com/teganbroderick/Travelmaps
Create and activate a virtual environment inside your travelmaps directory:
$ virtualenv env
$ source env/bin/activate
Install dependencies:
$ pip install -r requirements.txt
Add your API key into the header scripts in static/templates/dashboard.html, map.html, profile.html, and share_map.html, eg:

Create database 'travelmaps':
$ createdb travelmaps
Run model.py interactively in the terminal, and create database tables:
$ python3 -i model.py
>>> db.create_all()
>>> quit()
Run the app from the command line.
$ python server.py
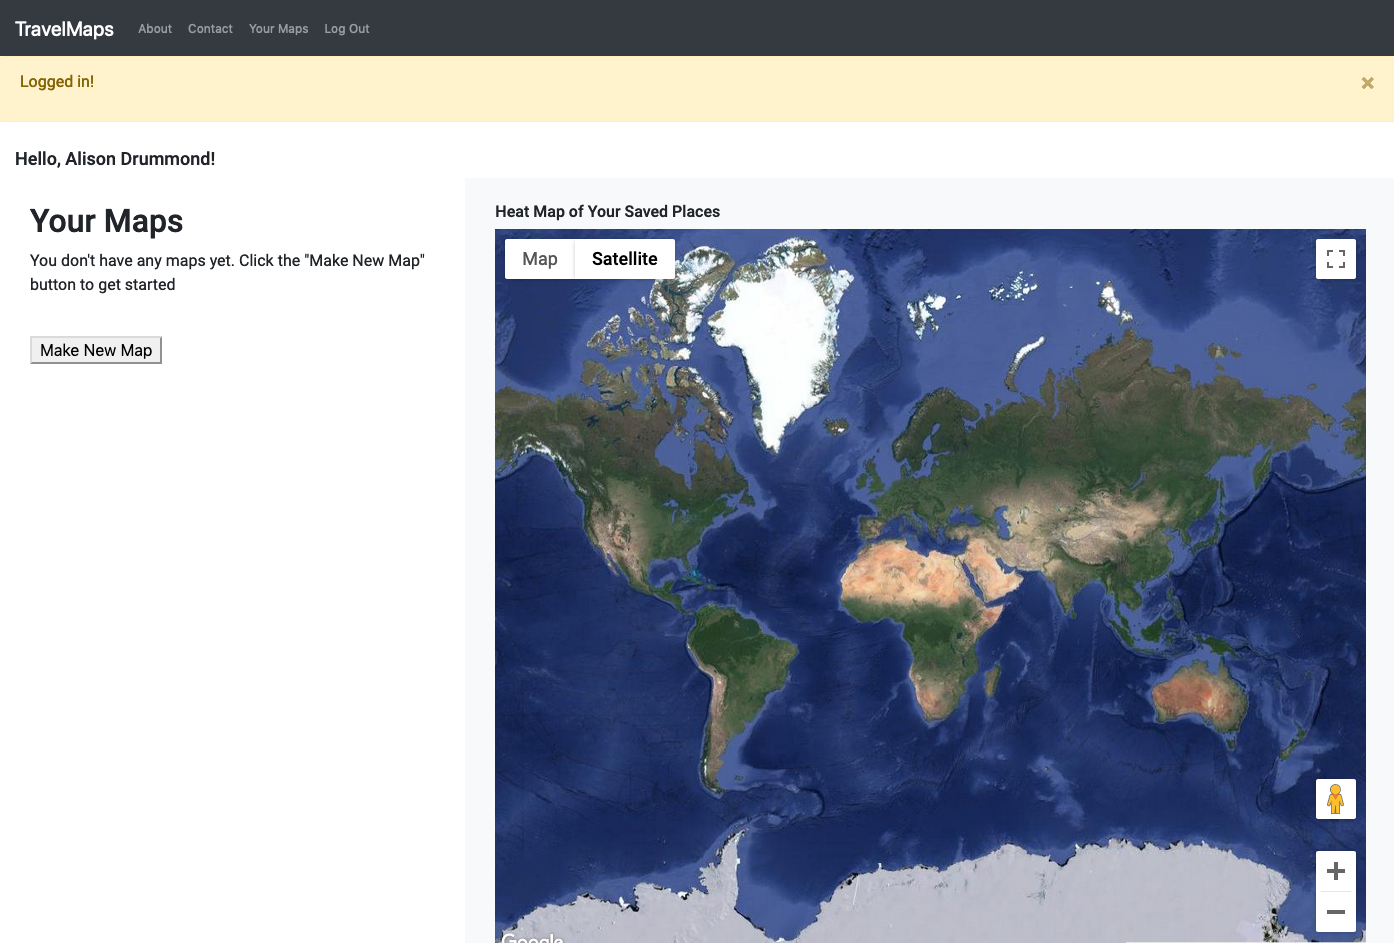
A list of the user's maps is shown on the left hand side of the page. If the user has not made any maps yet, they prompted to get started by clicking the "Make New Map" button. A heat map visualizing all of the users saved places is shown on the right hand side of the page.
New User:
Established User:

Users make individual maps and can opt to add a map description.

Users search for places using the Google Maps Places api. A custom marker info-window allows users to view place information, add place-specific notes, and save the place to the map.
As markers are saved, a list of saved places is displayed on the left hand side of the page. Clicking on a place header in the list centers the map on that place marker, and opens another custom info-window displaying place information and a button that deletes the place from the map. Users can also click directly on a marker to view its info-window. Clicking on a website link in the list opens the website in a new browser tab.
Places can be deleted from a map by clicking on the "Delete location from map" button in a saved place info-window.

A dynamic, read-only version of each map can be shared across the web using a shareable link.
An internal dashboard is visible only to 'staff users' of the site, as defined in my data model. The dashboard shows aggregated data about trends across all users, visualized in a table, two chart.js charts, and a google maps heat map.
- The bar chart shows the top 10 places saved across all maps
- The donut chart shows the top five types of places (as defined by Google Maps) saved across all maps
- The heat map shows the concentration of places saved across all Maps
- The table shows user statistics
- Modify data model and map permissions to allow multiple users to contribute to a single map
- Export dashboard data to an excel, csv, or jpg file
- Add dashboard page with aggregated data for each individual user
TravelMaps creator Tegan Broderick is a former art conservator and museum collections manager turned software engineer. This is her first fullstack project. She can be found on LinkedIn and on Github.