Skip to content
New issue

Have a question about this project? Sign up for a free GitHub account to open an issue and contact its maintainers and the community.

By clicking “Sign up for GitHub”, you agree to our terms of service and privacy statement. We’ll occasionally send you account related emails.

Already on GitHub? Sign in to your account

Memory leak with DqnAgent #569

Closed
romandunets opened this issue Feb 25, 2021 · 14 comments
Closed

Memory leak with DqnAgent #569

romandunets opened this issue Feb 25, 2021 · 14 comments
Assignees

Comments

@romandunets
Copy link

romandunets commented Feb 25, 2021

I have built basic DQN agent to play within CartPole environment by following the DQN tutorial: https://www.tensorflow.org/agents/tutorials/1_dqn_tutorial However, after couple of training hours I noticed that process is increasing memory consumption substantially. I was able to simplify the training script in order to narrow down the problem and figured out that memory leaks whenever driver is using agent.policy or agent.collect_policy (replacing that one with RandomTFPolicy eliminates the issue):

import tensorflow as tf
import gc

from tf_agents.environments import suite_gym, tf_py_environment
from tf_agents.networks import q_network
from tf_agents.agents.dqn import dqn_agent
from tf_agents.drivers import dynamic_step_driver
from tf_agents.utils import common

tf.compat.v1.enable_v2_behavior()

# Create CartPole as TFPyEnvironment
env = suite_gym.load('CartPole-v0')
tf_env = tf_py_environment.TFPyEnvironment(env)

# Create DQN Agent
q_net = q_network.QNetwork(
        tf_env.observation_spec(),
        tf_env.action_spec(),
        fc_layer_params=(100,))
optimizer = tf.keras.optimizers.Adam(learning_rate=0.01)
train_step_counter = tf.Variable(0)

agent = dqn_agent.DqnAgent(
    tf_env.time_step_spec(),
    tf_env.action_spec(),
    q_network=q_net,
    optimizer=optimizer,
    td_errors_loss_fn=common.element_wise_squared_loss,
    train_step_counter=train_step_counter)

agent.initialize()

# Replacing agent.collect_policy with tf_policy eliminates issue a of memory leak
# tf_policy = random_tf_policy.RandomTFPolicy(action_spec=train_env.action_spec(),
#                                            time_step_spec=train_env.time_step_spec())

# Create dynamic step driver with no observers
driver = dynamic_step_driver.DynamicStepDriver(
    env = tf_env,
    policy = agent.collect_policy,
    observers = [],
    num_steps = 1)

# Calls to driver end up continuously increasing memory consumption 
while True:
    driver.run()
    # One of the possible solutions is to call gc.collect() but it significantly slows down training

Other hotfix as mentioned in the code above is to call gc.collect() after each driver.run() but that has huge impact on the performance.

This memory leak prevents long-running training process which might be a bit of bummer for more complex environments based on DQN.

Running setup:

  • Ubuntu 20.10 / 64-bit
  • Python 3.8.6 + tensorflow==2.4.1 + tf-agents==0.7.1
  • Running on the CPU: AMD Ryzen Threadripper 3960x
  • RAM: 128GB

Same script has been also run within Docker container and confirmed memory leak.

What could be possible cause for this problem and how to properly fix it?

@ebrevdo
Copy link
Contributor

ebrevdo commented Mar 18, 2021

@romandunets this is a bit hard to debug because it sounds like it takes a while for the issue to appear.

To see if this is caused by something in eager mode, try this:

run = tf.function(driver.run, autograph=False)

while True:
  run()

that should run the same graph over and over, bypassing eager mode computation for the most part. let us know if that fixes the leak and if so, we can let TF team know about this.

@ebrevdo ebrevdo self-assigned this Mar 18, 2021
@romandunets
Copy link
Author

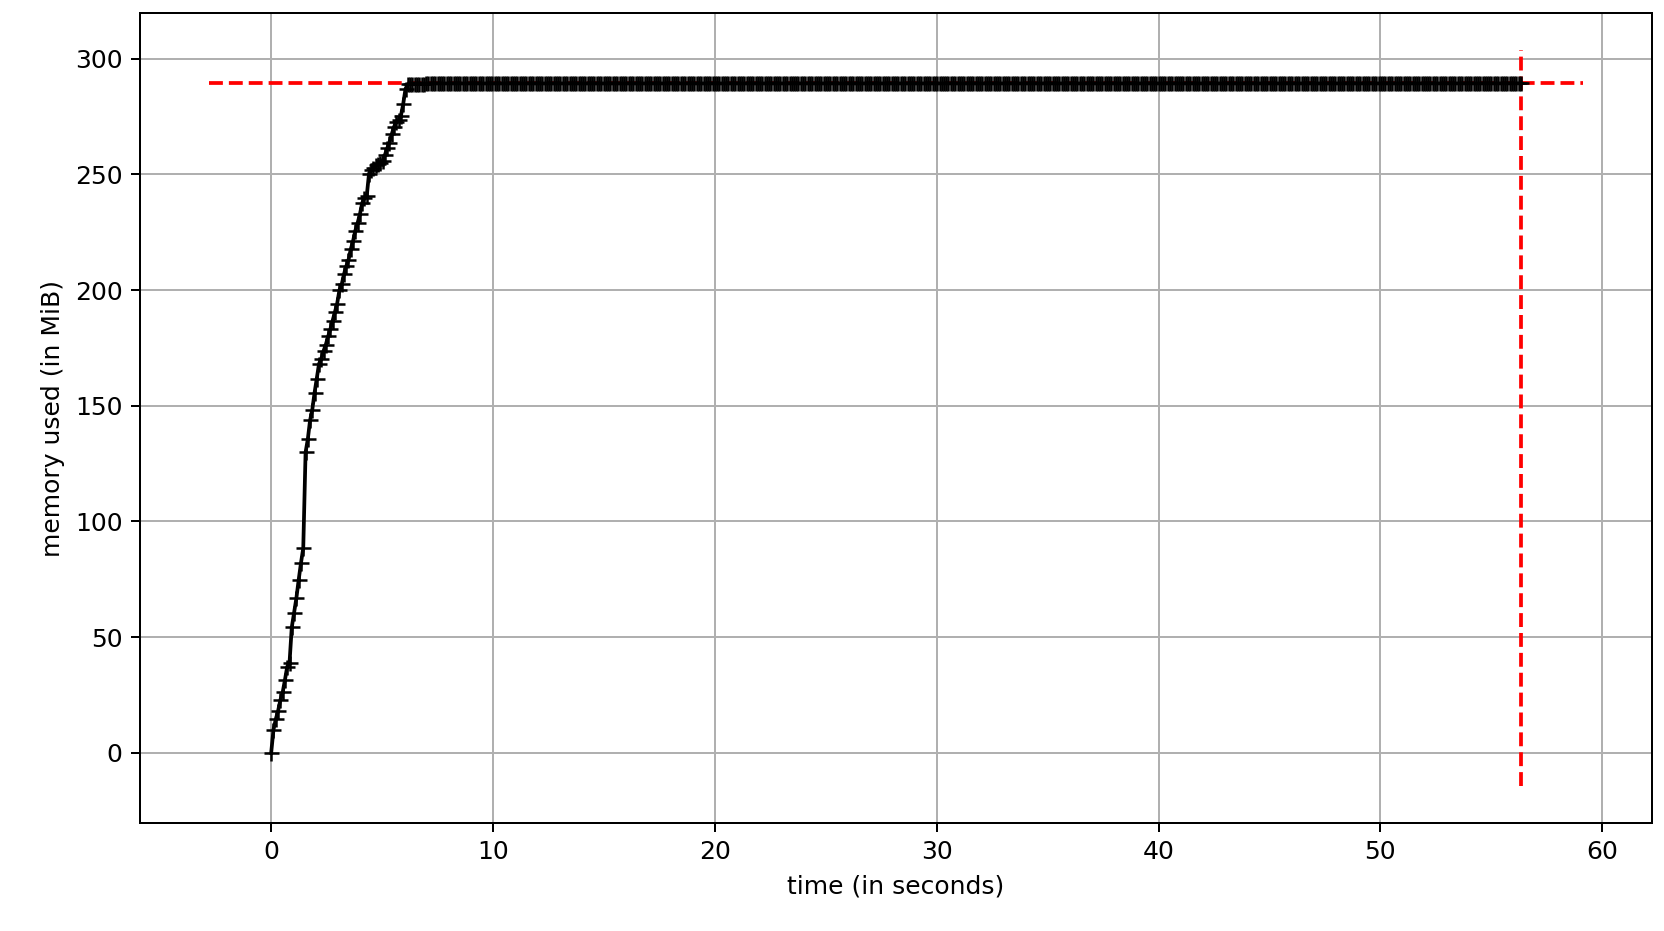
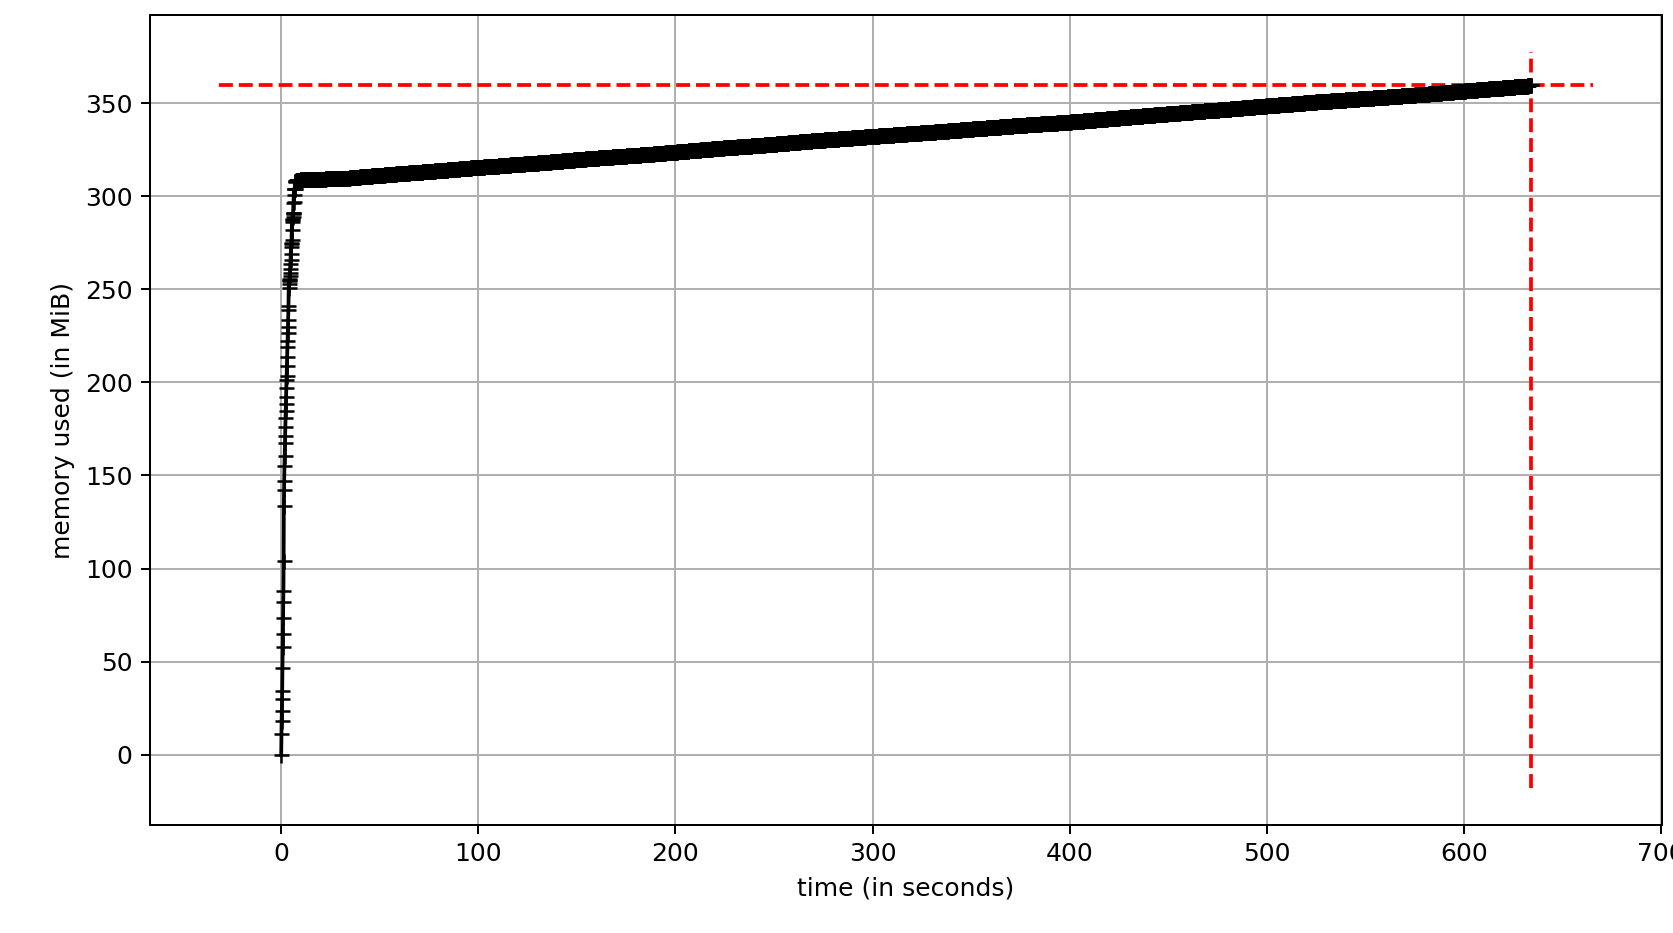
@ebrevdo Thanks for response! Actually, the issue is visible just after first 30 seconds of running the script I provided above. Here is the memory usage of that one after running collection loop for the first 100000 iterations:
memory_1

Wrapping driver.run into tf.function with autograph=False indeed helped to fix the issue of memory leakage when running driver (same 100000 iterations) while improving overall performance as well (execution was almost 8 times faster!):
memory_2

Taking one step further and introducing (replacing collection with)agent.train in the loop actually revealed another memory issue this time with agent.train:

import tensorflow as tf

from tf_agents.environments import suite_gym, tf_py_environment
from tf_agents.networks import q_network
from tf_agents.agents.dqn import dqn_agent
from tf_agents.replay_buffers import tf_uniform_replay_buffer
from tf_agents.drivers import dynamic_step_driver
from tf_agents.utils import common

tf.compat.v1.enable_v2_behavior()

# Create CartPole as TFPyEnvironment
env = suite_gym.load('CartPole-v0')
tf_env = tf_py_environment.TFPyEnvironment(env)

# Create DQN Agent
q_net = q_network.QNetwork(
        tf_env.observation_spec(),
        tf_env.action_spec(),
        fc_layer_params=(100,))
optimizer = tf.keras.optimizers.Adam(learning_rate=0.01)
train_step_counter = tf.Variable(0)

agent = dqn_agent.DqnAgent(
    tf_env.time_step_spec(),
    tf_env.action_spec(),
    q_network=q_net,
    optimizer=optimizer,
    td_errors_loss_fn=common.element_wise_squared_loss,
    train_step_counter=train_step_counter)
agent.initialize()
train = tf.function(agent.train, autograph=False)

# Create Replay Buffer
replay_buffer = tf_uniform_replay_buffer.TFUniformReplayBuffer(
    data_spec = agent.collect_data_spec,
    batch_size = tf_env.batch_size,
    max_length = 1000)

dataset = replay_buffer.as_dataset(
    num_parallel_calls = 3,
    sample_batch_size = 64,
    num_steps = 2).prefetch(3)
iterator = iter(dataset)

# Create dynamic step driver with no observers
driver = dynamic_step_driver.DynamicStepDriver(
    env = tf_env,
    policy = agent.collect_policy,
    observers = [ replay_buffer.add_batch ],
    num_steps = 1)
collect = tf.function(driver.run, autograph=False)

# Prepopulate Replay Buffer
time_step = None
policy_state = agent.collect_policy.get_initial_state(tf_env.batch_size)
for i in range(1000):
    time_step, policy_state = collect(time_step, policy_state)

# Select single experience for training
experience, _ = next(iterator)

# Calls to agent.train end up continuously increasing memory consumption
for i in range(100000):
    agent.train(experience)

Memory usage steadily increases along the time:
memory_3

Wrapping agent.train into tf.function with autograph=False and then calling that one also didn't helped as you can see from above. So is there some fix for this memory leak?

@Veluga
Copy link
Contributor

Veluga commented Mar 30, 2021

I don't think this is an issue with the DqnAgent. I've been having the same issue with both the CategoricalDqnAgent and ReinforceAgent.

@ebrevdo
Copy link
Contributor

ebrevdo commented Apr 19, 2021

Thanks for the update. Looks like we should increase the priority of this issue.

@ebrevdo
Copy link
Contributor

ebrevdo commented Apr 19, 2021

BTW we've been moving to Actor/Learner which takes care of a lot of this for you. There's a DQN example here. Additionally it uses Reverb replay buffer, which is a preferred way to pass data between collection & training.

Can you try using that and seeing if the memory leak disappears?

@tomdelewski
Copy link

I've been trying to figure out a very similar problem, and the code I'm running is basically the same as above. I've noticed that the issue doesn't seem to happen when I call agent.train as a Python function instead of wrapping it in a tf.function. It loses some speed, but not quite as much as using pure Python everything.

@romandunets
Copy link
Author

@ebrevdo I used the exact script you referenced for memory profiling and realized that it demonstrates same memory leakage issues as the original script I used:
memory_profile

@romandunets
Copy link
Author

I've been trying to figure out a very similar problem, and the code I'm running is basically the same as above. I've noticed that the issue doesn't seem to happen when I call agent.train as a Python function instead of wrapping it in a tf.function. It loses some speed, but not quite as much as using pure Python everything.

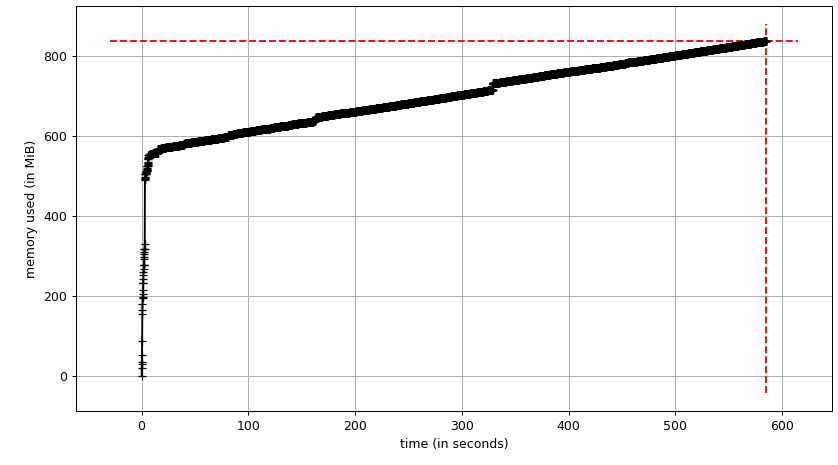
Unfortunately, both wrapped and unwrapped agent.train functions are showing pretty much the same memory consumption trend with the simple example code as above.

@ebrevdo
Copy link
Contributor

ebrevdo commented May 2, 2021

Using tracemalloc on dqn_train_eval I see the top memory increase duringg the loop coming from

[
<StatisticDiff traceback=<Traceback (<Frame filename='/home/ebrevdo/.local/lib/python3.8/site-packages/tensorflow/python/eager/context.py' lineno=151>,)> size=300412 (+240168) count=5005 (+4001)>,
<StatisticDiff traceback=<Traceback (<Frame filename='/home/ebrevdo/.local/lib/python3.8/site-packages/tensorflow/python/eager/context.py' lineno=1109>,)> size=240632 (+192000) count=5005 (+4000)>,
]

Tracing this to my tf-nightly package these are the lines

  @config_proto_serialized.setter
  def config_proto_serialized(self, config):
    if isinstance(config, config_pb2.ConfigProto):
      self._config_proto_serialized = config.SerializeToString(
          deterministic=True)

this is a setter of class FunctionCallOptions.

and

      self._thread_local_data.function_call_options = FunctionCallOptions(
          config_proto=config)

in the property function_call_options.

If I add a print command to setter config_proto_serialized I see that it's being executed every single time we call train, this path is being executed

Here's the backtrace for when this happens:

> /home/ebrevdo/.local/lib/python3.8/site-packages/tensorflow/python/eager/context.py(157)config_proto_serialized()
-> self._config_proto_serialized = config.SerializeToString(
(Pdb) bt
  /home/ebrevdo/.local/lib/python3.8/site-packages/tf_agents/examples/dqn/dqn_train_eval.py(268)<module>()
-> multiprocessing.handle_main(functools.partial(app.run, main))
  /home/ebrevdo/.local/lib/python3.8/site-packages/tf_agents/system/default/multiprocessing_core.py(78)handle_main()
-> return app.run(parent_main_fn, *args, **kwargs)
  /home/ebrevdo/.local/lib/python3.8/site-packages/absl/app.py(300)run()
-> _run_main(main, args)
  /home/ebrevdo/.local/lib/python3.8/site-packages/absl/app.py(251)_run_main()
-> sys.exit(main(argv))
  /home/ebrevdo/.local/lib/python3.8/site-packages/absl/app.py(300)run()
-> _run_main(main, args)
  /home/ebrevdo/.local/lib/python3.8/site-packages/absl/app.py(251)_run_main()
-> sys.exit(main(argv))
  /home/ebrevdo/.local/lib/python3.8/site-packages/tf_agents/examples/dqn/dqn_train_eval.py(259)main()
-> train_eval(
  /home/ebrevdo/.local/lib/python3.8/site-packages/gin/config.py(1046)gin_wrapper()
-> return fn(*new_args, **new_kwargs)
  /home/ebrevdo/.local/lib/python3.8/site-packages/tf_agents/examples/dqn/dqn_train_eval.py(242)train_eval()
-> dqn_learner.run(iterations=1)
  /home/ebrevdo/.local/lib/python3.8/site-packages/tf_agents/train/learner.py(238)run()
-> loss_info = self._train(iterations, iterator)
  /home/ebrevdo/.local/lib/python3.8/site-packages/tensorflow/python/eager/def_function.py(867)__call__()
-> result = self._call(*args, **kwds)
  /home/ebrevdo/.local/lib/python3.8/site-packages/tensorflow/python/eager/def_function.py(902)_call()
-> results = self._stateful_fn(*args, **kwds)
  /home/ebrevdo/.local/lib/python3.8/site-packages/tensorflow/python/eager/function.py(3018)__call__()
-> return graph_function._call_flat(
  /home/ebrevdo/.local/lib/python3.8/site-packages/tensorflow/python/eager/function.py(1960)_call_flat()
-> return self._build_call_outputs(self._inference_function.call(
  /home/ebrevdo/.local/lib/python3.8/site-packages/tensorflow/python/eager/function.py(579)call()
-> function_call_options = ctx.function_call_options
  /home/ebrevdo/.local/lib/python3.8/site-packages/tensorflow/python/eager/context.py(1115)function_call_options()
-> self._thread_local_data.function_call_options = FunctionCallOptions(
  /home/ebrevdo/.local/lib/python3.8/site-packages/tensorflow/python/eager/context.py(134)__init__()
-> self.config_proto_serialized = config_proto
> /home/ebrevdo/.local/lib/python3.8/site-packages/tensorflow/python/eager/context.py(157)config_proto_serialized()
-> self._config_proto_serialized = config.SerializeToString(

Looks like ctx.function_call_options is having trouble memoizing function_call_options in self._thread_local_data. This is may be the cause of the memory leak or it may be a red herring. I'll have to get some TF core folks to check this out.

@jaingaurav do you know this codepath? who should take a look to help debug this memory leak?

@ebrevdo
Copy link
Contributor

ebrevdo commented May 2, 2021

Investigating the backtrace, it doesn't look like thread_local_data is being recreated each time; it just seems like thread_local_data.function_call_options of the same TLD is being set to None (or is somehow being forgotten), and the underlying FunctionCallOptions object isn't being garbage collected. thread_local_data is a pywrap_tfe.EagerContextThreadLocalData so there's some pybind11-foo that I don't have time to investigate. @allenlavoie may additionally know who would be able to help debug this "disappearing function_call_options" issue.

@allenlavoie
Copy link
Member

Is this being called from a new thread each time? As far as I know there's no eviction for thread_local data when the thread goes away.

For debugging on the TF side please file a tensorflow/tensorflow bug.

@ebrevdo
Copy link
Contributor

ebrevdo commented May 3, 2021

No; this is definitely all from the same thread. I'll file a bug.

@ebrevdo
Copy link
Contributor

ebrevdo commented May 3, 2021

Filed tensorflow/tensorflow#48888.

@ebrevdo
Copy link
Contributor

ebrevdo commented May 3, 2021

Moving the conversation to that bug.

copybara-service bot pushed a commit that referenced this issue May 18, 2021
…ady set.

This speeds up dqn_train_eval from ~470 steps/sec to ~500 steps/sec, giving
a 6% performance boost.

Fixes #569; though other changes by TF team address the actual memory
leak (see tensorflow/tensorflow#48888).

PiperOrigin-RevId: 374511986
Change-Id: I378ff6760e1ec620441b75d6c627929df3fdc335
Sign up for free to join this conversation on GitHub. Already have an account? Sign in to comment
Labels
None yet
Projects
None yet
Development

No branches or pull requests

5 participants