Profile plugin, trace viewer, does not work in Chrome 80+ #3209
Comments
|
Is there any way around this? I've tried to install an older version of chrome on ubuntu and have been unsuccessful |
|
A Chromium bug here was filed to fix/upgrade the Catapult trace viewer. I would recommend 'starring' the chromium bug report to add attention. At this time, there isn't a fix, but there are workarounds if viewing Profile data is critical:
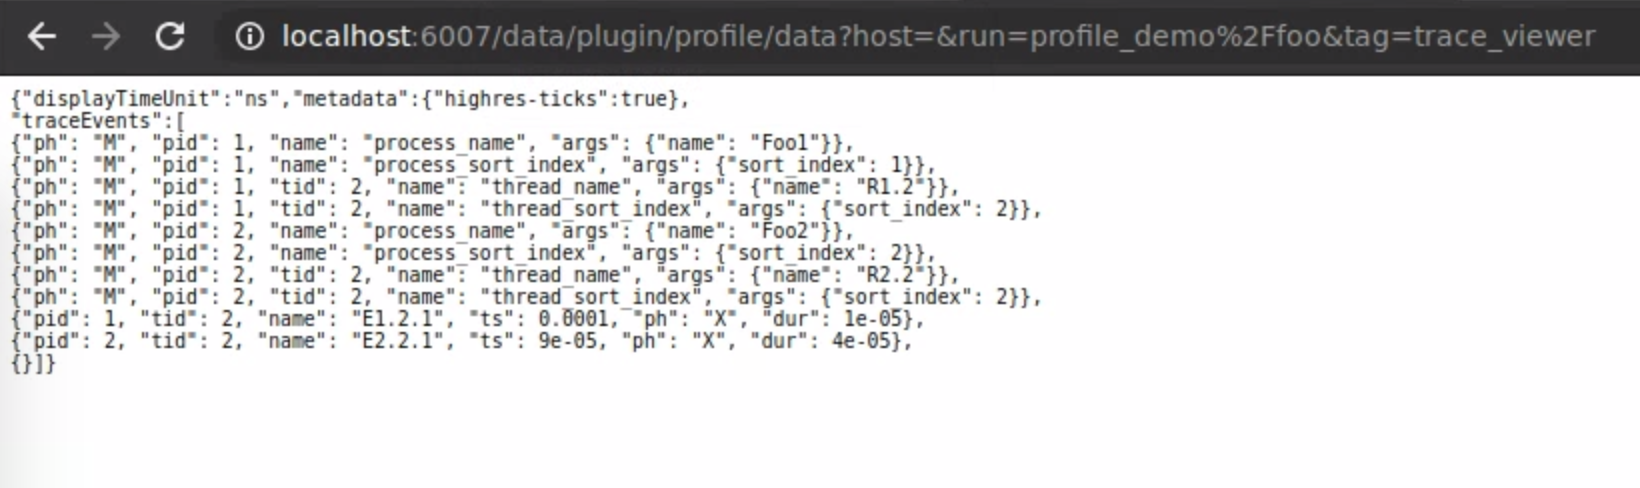
To get your data from TensorBoard, you can craft a URL like for example:
Note that using an older version of Chromium for an extended period introduces security risks. |
Show warning if trace viewer is used with WebComponents v0. The message directs users to a workaround and more details at: #3209
@psybuzz How is this done? |
|
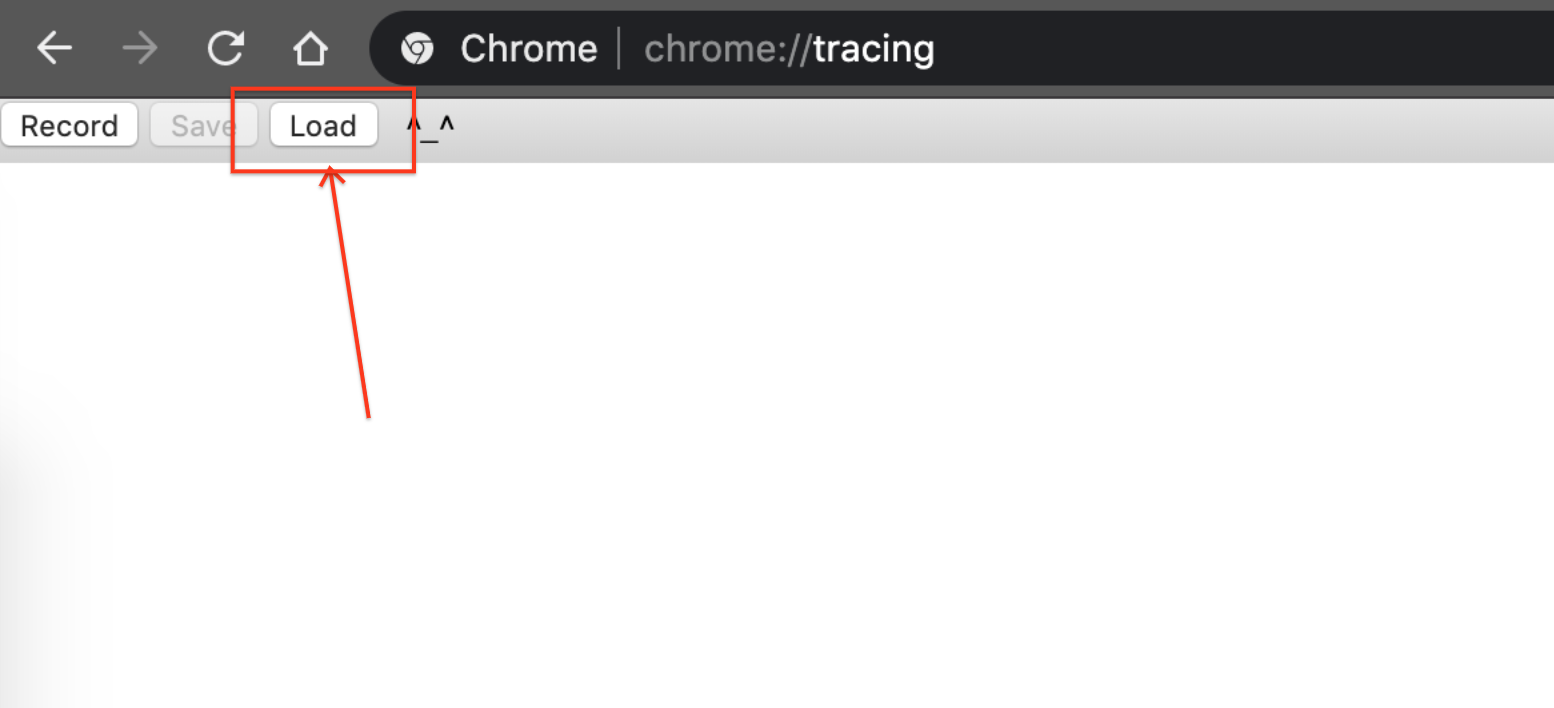
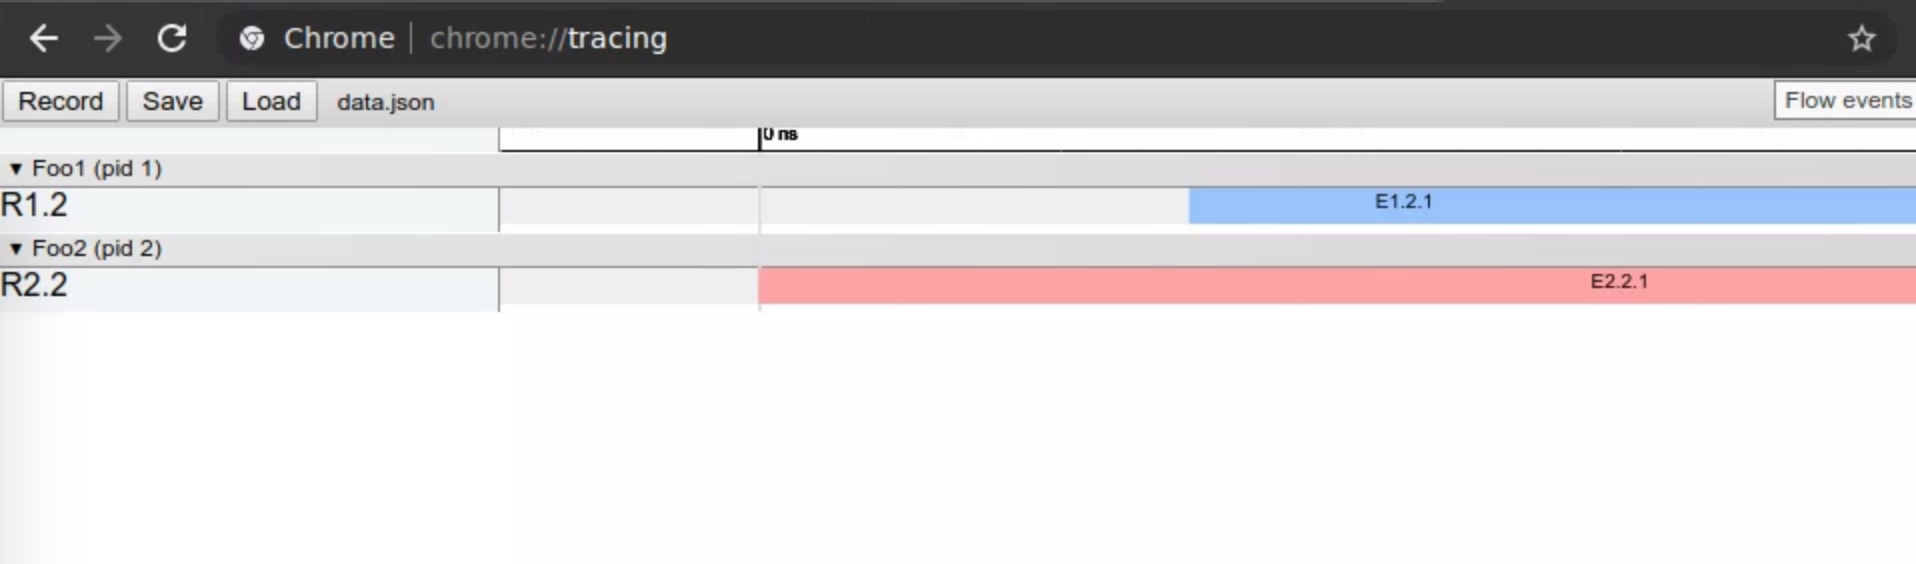
If your TensorBoard process is running and you have a Chromium-based browser (e.g. the new Edge, Brave, Opera, Chrome), you can do this specifically as follows:
Please let us know if one of these steps doesn't work. |

|
@psybuzz Perfect, thank you. |
|
Got the same problem and if the Host is local, you need to add a point after local like |
|
It looks like this was fixed in the master branch of catapult, but I couldn't figure out how to get the fix into Chrome or Firefox. I tried installing the Canary version of Chrome to no avail. Also tried downloading both the UPDATE - downloaded correct file |
|
Hi, I was able to get the workaround working. But I'm curious - could there be another issue? When looking at the Chrome network trace, it's loading from a URL of the form |
|
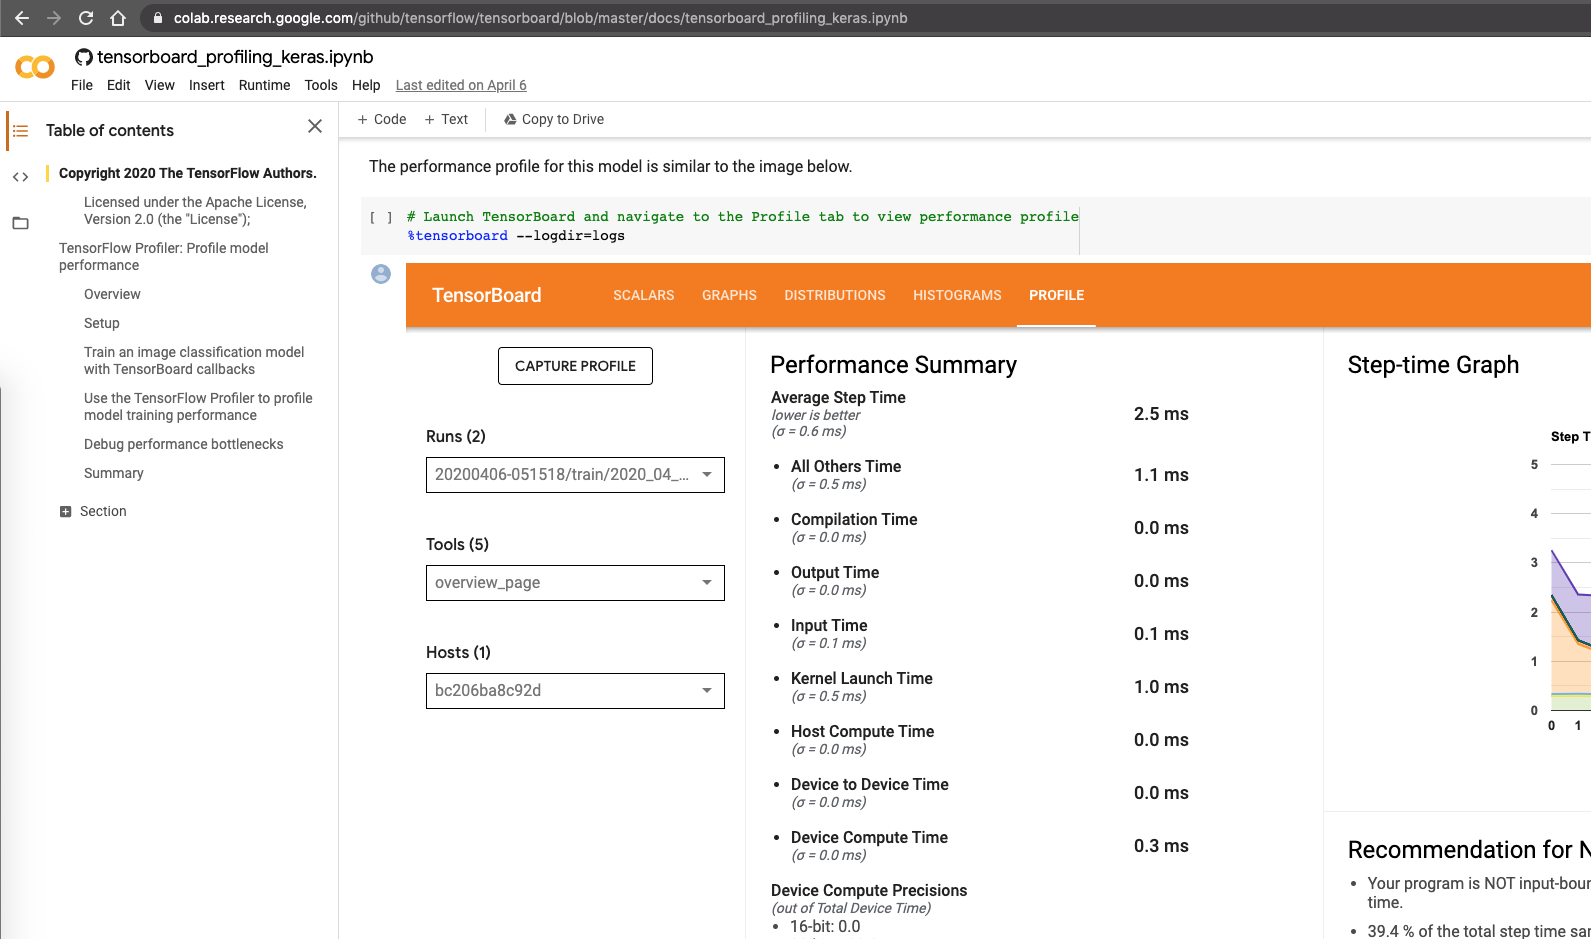
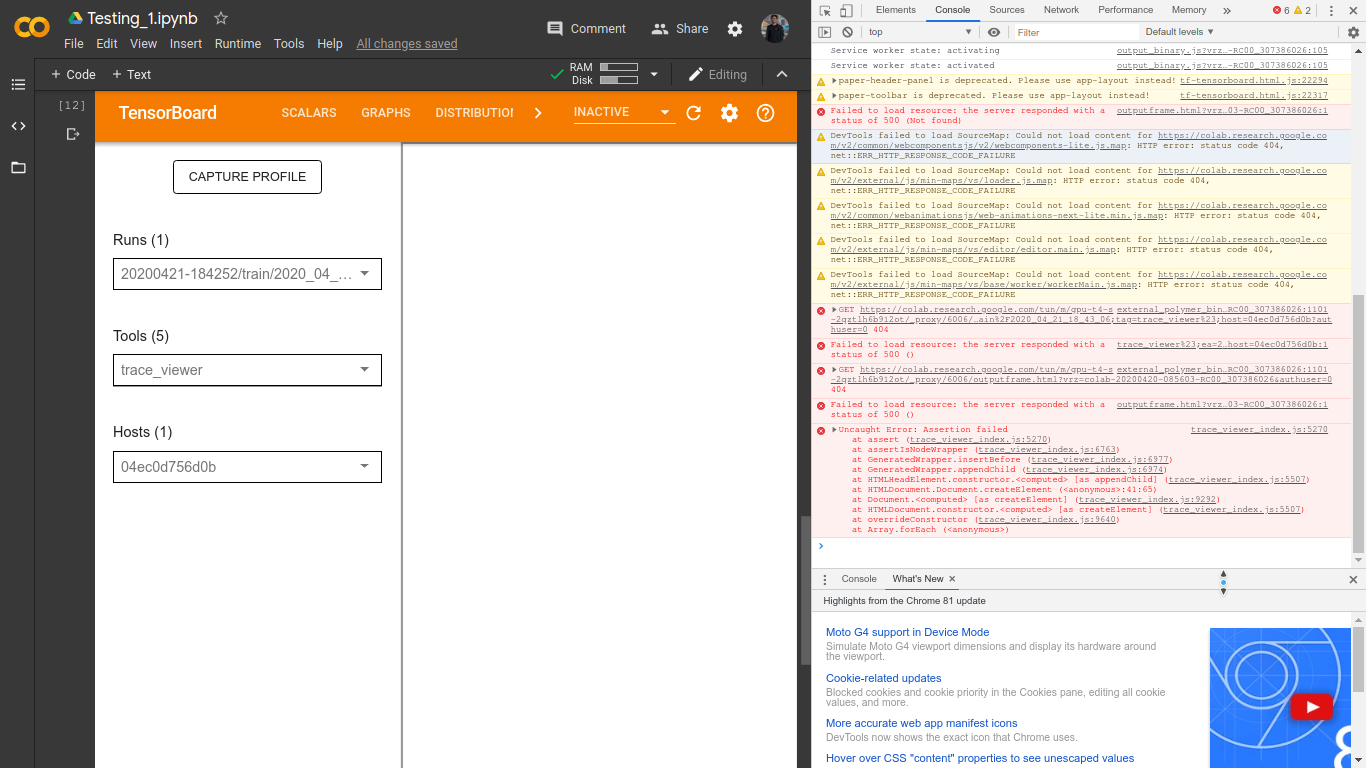
@psybuzz I'm following the tutorial on TensorFlow Profiler: Profile model performance and I decided to test it on colab.research.google.com . Screenshot is attached,
I'm unsure how to exactly copy or get that long string for |

|
Hi @Rubix982 , thanks for the screenshot. I'm unable to reproduce a blank screen on Colab, the tutorial seems to work for me. Could you please share:
|
|
Hi, @psybuzz ! Thanks for your time. I used Ctrl + Shift + J, and yes, there were warnings and errors. An overview of them is given below. A screenshot is also attached below to give a look at the original errors (how I actually see them vs copy pasted here in the debug console tab), The screenshot,
Again, thank you for your time! If there is any other information that you require, please let me know. |
|
The screenshot and errors are helpful. There's a strange assertion error from the webcomponents polyfill code. Since the polyfill is at the start of the JS bundle in the trace viewer iframe, this should imply that we have properly received the JS bundle and started evaluating it. Based on webcomponents/webcomponentsjs#301 (a similar error), it seems like this could happen if someone other than our JS bundle evaluates DOM APIs before the polyfill loads. It might be possible for a Chrome extension to run scripts in the iframe before our JS bundle. Could you please trying this out in Incognito (usually has no extensions enabled) or in a browser profile without extensions enabled? If that doesn't work, could you also try this out in Firefox, if available? I'm curious whether it is something browser specific. cc @qiuminxu @ydko for visibility, and if they have any ideas |
|
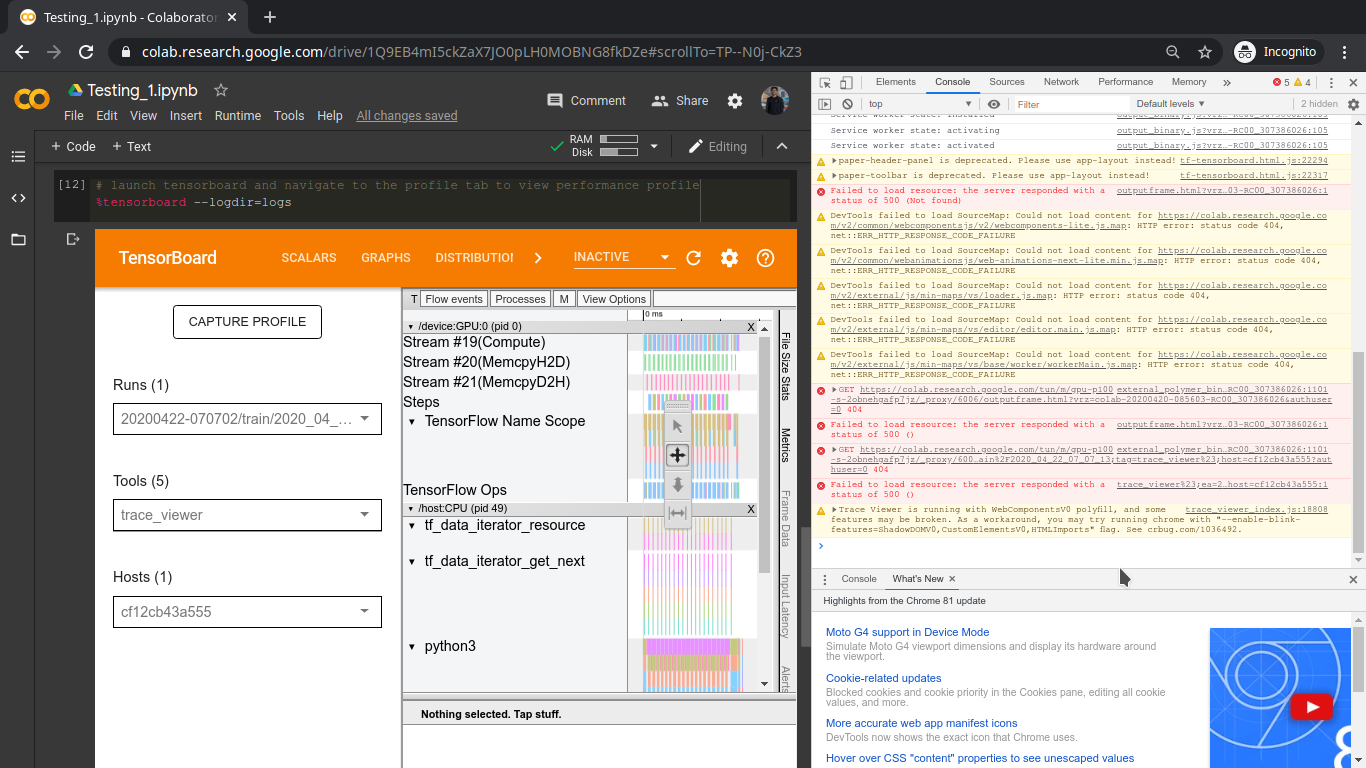
@psybuzz , It works with Incognito!
Though I still see some warnings and errors in red as well, still. |
|
@psybuzz any updates on this? |
|
As of latest TensorBoard and https://www.tensorflow.org/tensorboard/tensorboard_profiling_keras, the profile plugin should work on Firefox, Chrome, and others. Please give the new plugin a try. Thanks! |
Chrome 80+ deprecated two APIs:
document.registerElementandElement.prototype.createShadowRoot. This broke Chrome's trace viewer, Catapult, which was assuming presence of the APIs on Chrome (it did not include proper polyfills; was only meant to run in Chrome anyways!).To overcome the issue, we have tried few things and I will try to enumerate what was tried:
document.registerElementdocument.registerElementPolymer.Settingsdoes feature detection by checking for certain APIsElement.prototype.createShadowRootwhich is critical for the feature detection: https://github.com/Polymer/polymer/blob/7a0f0181f573b79a1ec0b42a12bee37508ca52c6/polymer-micro.html#L33Element.prototype.createShadowRootby usingElement.prototype.attachShadowcreateShadowRoot, we still get belowAt this point, we can try to identify the problem and manually patch everything to make sure trace_viewer works (barely), but I think we should try to look what it will take to:
If above two things are done, we will be able to fix #1291.
@psybuzz I can see how to vulcanize the trace viewer but I have no idea how the dependencies are managed in Chromium/catapult. Can you please help us try above two? I think I can, too, check for correctness of (1).
The text was updated successfully, but these errors were encountered: