Skip to content
New issue

Have a question about this project? Sign up for a free GitHub account to open an issue and contact its maintainers and the community.

By clicking “Sign up for GitHub”, you agree to our terms of service and privacy statement. We’ll occasionally send you account related emails.

Already on GitHub? Sign in to your account

Massive memory leaks due to data.Dataset.shuffle #44176

Closed
sehoffmann opened this issue Oct 20, 2020 · 35 comments
Closed

Massive memory leaks due to data.Dataset.shuffle #44176

sehoffmann opened this issue Oct 20, 2020 · 35 comments
Assignees
Labels
comp:data tf.data related issues TF 2.3 Issues related to TF 2.3 type:performance Performance Issue

Comments

@sehoffmann
Copy link

System information

  • Have I written custom code (as opposed to using a stock example script provided in TensorFlow): Yes
  • OS Platform and Distribution (e.g., Linux Ubuntu 16.04): 18.04.1-Ubuntu
  • TensorFlow installed from (source or binary): binary
  • TensorFlow version (use command below): v2.3.0-54-gfcc4b966f1 2.3.1
  • Python version: 3.6.9
  • CUDA/cuDNN version: 10.1
  • GPU model and memory: GTX 2080 Ti, ~11gb

Describe the current behavior
When a new iterator to a dataset containing a shuffle() iteration is opened after the old one became completely exhausted,
the memory held by the ShuffleDataset is not released / reused, resulting in massive memory leaks and ultimately in the process being killed by the OOM reaper.

For this purpose it does not matter whether we manually iterate over the dataset, use a Keras function like Model.fit() or chain a Dataset.repeat() operation at the end.
The original bug was found in production code and the condensed code below outlines roughly our original data pipeline
but perfectly reproduces the problem.

Describe the expected behavior
Memory usage should be constant when a new iterator to the Dataset is opened and there are no existing iterators anymore.

To be extra safe it might be desirable to immediately release any memory held by the ShuffleDataset when iteration is done,
so that other components can use it. (maybe introduce parameter controlling the behaviour?). This could be very important in conjunction with Dataset.interleave(), e.g when we iterate 36 files with a cycle_length of four and only have enough memory to hold 4 shuffle buffers in memory. If memory is not immediately released, we would run out of memory after the first four files have been processed.

Standalone code to reproduce the issue
I run the code with the memory-profiler package (https://pypi.org/project/memory-profiler/) to generate plots of the memory usage. By default shuffle buffers are enabled but when any additional argv is passed, shuffle buffers will be disabled:

Example usage: mprof run --include-children test.py or mprof run --include-children test.py no-shuffle

I recommend at least 32 GB of memory so that you can properly observe the behaviour. Otherwise feel free to tune down the memory usage in the code, for example by reducing the image size from 512x512 to 256x256.

import sys
import tensorflow as tf

do_shuffle = len(sys.argv) <= 1

# Simulate reading from files
filenames = tf.data.Dataset.from_tensor_slices(['{}.data'.format(i) for i in range(16)])

def read_files(files):
    # In the original code we open TFRecordDatasets here
    N = 8192 * 4

    def gen():
        for _ in range(N // 32):
            yield tf.random.normal([32, 512, 512, 1])

    rng_ds = tf.data.Dataset.from_generator(gen, tf.float32).unbatch()
    return rng_ds

readers_ds = filenames.batch(4).map(read_files, num_parallel_calls=1, deterministic=True)

def process(ds):
    # Create windows of 4 and add them as extra T dimension 
    window_size = 4
    ds = ds.window(window_size, shift=1, drop_remainder=True).flat_map(lambda x: x).batch(window_size)
    
    # buffer size = 1.07 GB (256 * 4 * 512 * 512 * 4)
    if do_shuffle:
        ds = ds.shuffle(    
            256, 
            reshuffle_each_iteration=True
        )

    return ds

# interleave will result in 4 iterators being opened in parallel
# which iterate the whole dataset (each iterates 4 files and there are 32 files in total)
ds = readers_ds.interleave(
        process,
        cycle_length=4,   # total buffer size: 1.07 GB * 4 = 4.29 GB
        block_length=1,
        num_parallel_calls=1,
        deterministic=False
    )

ds = ds.batch(32)

for e in range(30):
    print('epoch: ', e)

    # this creates a temporary iterator to the dataset
    for x in ds:
        pass

Other info / logs
The first run uses shuffling and we can clearly see the buffer filling up again after each epoch without the old memory being released (it appears that sometimes a small fraction is released though). I'm not sure why the buffers use 8gb in total opposed to the theoretical 4gb. After the fourth epoch the process is killed on my machine, because i run out of memory (32gb):

shuffle

Log:

epoch:  0
epoch:  1
epoch:  2
epoch:  3
epoch:  4

For the second run I disabled shuffling and we can see that there is still some leakage yet much more irregularly. In previous test runs which used our original data-pipeline, I was able to achieve a flat memory usage by disabling the shuffling; I'm not sure why it doesn't work with the test script though. This might require further investigation. I manually terminated the script after a while.

no-shuffle

Log:

epoch:  0
epoch:  1
epoch:  2
epoch:  3
epoch:  4
epoch:  5
@sehoffmann sehoffmann added the type:bug Bug label Oct 20, 2020
@amahendrakar amahendrakar added comp:data tf.data related issues TF 2.3 Issues related to TF 2.3 type:performance Performance Issue and removed type:bug Bug labels Oct 21, 2020
@gowthamkpr gowthamkpr assigned jsimsa and unassigned gowthamkpr Oct 22, 2020
@gowthamkpr gowthamkpr added the stat:awaiting tensorflower Status - Awaiting response from tensorflower label Oct 22, 2020
@jsimsa
Copy link
Contributor

jsimsa commented Oct 23, 2020

I cannot reproduce the issue when I ran your program using internal version of TensorFlow at HEAD and I am not aware of any issues that got fixed between TF 2.3 and now that could explain that.

Could you set the TF_CPP_VMODULE environment variable to dataset=2? This will log which tf.data iterators are being constructed and destructed. The shuffle transformation buffer is owned by the iterator, which would allow us to establish whether the buffer memory is being released at the end of each epoch or not.

Lastly, how do you measure the memory consumption?

@tensorflowbutler tensorflowbutler removed the stat:awaiting tensorflower Status - Awaiting response from tensorflower label Oct 25, 2020
@shauidu
Copy link

shauidu commented Oct 29, 2020

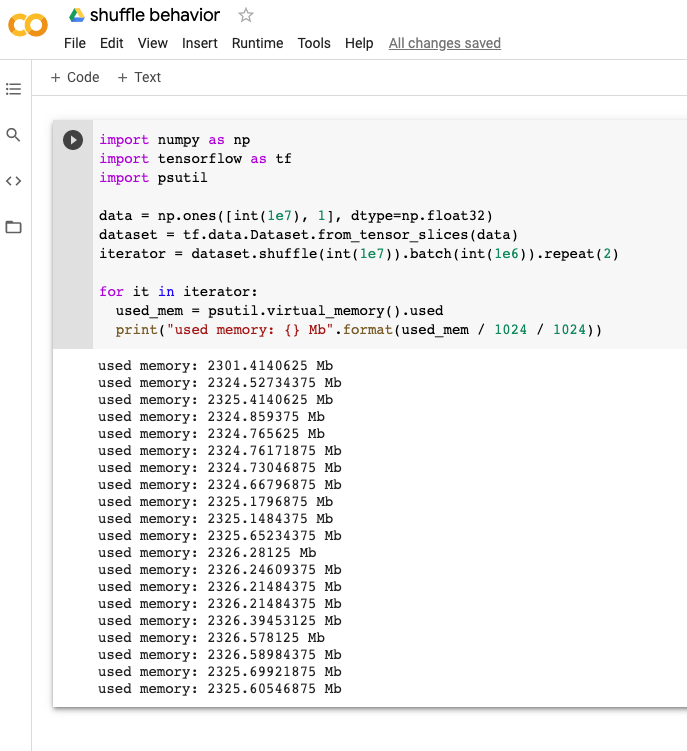
@jsimsa Can you check this code. The memory usage keeps increasing.

import numpy as np
import tensorflow as tf
import psutil

data = np.ones([int(1e7), 1], dtype=np.float32)
dataset = tf.data.Dataset.from_tensor_slices(data)
iterator = dataset.shuffle(int(1e7)).batch(int(1e6)).repeat(10)

for it in iterator:
  used_mem = psutil.virtual_memory().used
  print("used memory: {} Mb".format(used_mem / 1024 / 1024))

Am I using it correctly?
Thank you.

@jsimsa
Copy link
Contributor

jsimsa commented Oct 29, 2020

@shauidu I cannot reproduce this using public colab

Screen Shot 2020-10-29 at 10 30 43 AM

@federicoruggeri
Copy link

federicoruggeri commented Nov 18, 2020

I'm having the same issue.

System information(s) (I've tried two different configurations):
Tensorflow : 2.3.0 (gpu) ; 2.0 (gpu)
GPU: 2x 2080ti
CUDA: 10.1; 10.0
Python: 3.5

Issue:
Running the above test script with or without GPU leads to huge memory usage very quickly

Output:
used memory: 5203.69140625 Mb
used memory: 5211.5078125 Mb
used memory: 5272.92578125 Mb
used memory: 5308.12890625 Mb
used memory: 5356.12890625 Mb
used memory: 5404.41015625 Mb
used memory: 5453.68359375 Mb
used memory: 5502.7421875 Mb
used memory: 5551.15625 Mb
used memory: 5601.9296875 Mb
used memory: 5569.28515625 Mb
used memory: 5578.01953125 Mb
used memory: 5627.60546875 Mb
used memory: 5677.09375 Mb
used memory: 5723.94140625 Mb
used memory: 5772.9375 Mb
used memory: 5829.57421875 Mb
used memory: 5871.0703125 Mb
used memory: 5920.375 Mb
used memory: 5971.19921875 Mb

Edit:
I've checked the colab configuration and it uses tensorflow==2.3.0 (not tensorflow-gpu==2.3.0). Therefore, my initial guess was that maybe the issue was related to library version. However, also this setup shows the same issue.

Generally speaking, running the code in CPU mode shows some memory cleaning, but overall, memory usage increases as follows:

used memory: 6375.6015625 Mb
used memory: 6423.8203125 Mb
used memory: 6473.92578125 Mb
used memory: 6530.765625 Mb
used memory: 6571.97265625 Mb
used memory: 6623.296875 Mb
used memory: 6673.5546875 Mb
used memory: 6718.78515625 Mb
used memory: 6769.36328125 Mb
used memory: 6376.51171875 Mb <-- here's some cleaning
used memory: 6693.9921875 Mb <-- ??
used memory: 6703.70703125 Mb
used memory: 6751.8125 Mb
used memory: 6801.23046875 Mb
used memory: 6850.26953125 Mb
used memory: 6899.07421875 Mb
used memory: 6948.76953125 Mb
used memory: 6998.671875 Mb
used memory: 7048.421875 Mb
used memory: 7115.67578125 Mb

@jsimsa
Copy link
Contributor

jsimsa commented Nov 18, 2020

@federicoruggeri what do the numbers look like when you remove the shuffle transformation?

@federicoruggeri
Copy link

@jsimsa Disabling shuffle gives the following results. Memory usage seems stable.

CPU:
used memory: 6492.44921875 Mb
used memory: 6537.33203125 Mb
used memory: 6555.30859375 Mb
used memory: 6563.078125 Mb
used memory: 6566.87890625 Mb
used memory: 6584.36328125 Mb
used memory: 6567.640625 Mb
used memory: 6567.97265625 Mb
used memory: 6569.578125 Mb
used memory: 6569.79296875 Mb
used memory: 6569.296875 Mb
used memory: 6504.59765625 Mb
used memory: 6538.203125 Mb
used memory: 6556.16796875 Mb
used memory: 6563.2109375 Mb
used memory: 6566.70703125 Mb
used memory: 6566.79296875 Mb
used memory: 6576.90625 Mb
used memory: 6568.70703125 Mb

GPU:
used memory: 7211.34375 Mb
used memory: 7243.49609375 Mb
used memory: 7255.85546875 Mb
used memory: 7260.39453125 Mb
used memory: 7264.484375 Mb
used memory: 7213.5859375 Mb
used memory: 7243.359375 Mb
used memory: 7256.2890625 Mb
used memory: 7276.30859375 Mb
used memory: 7266.03515625 Mb
used memory: 7265.80859375 Mb
used memory: 7266.3125 Mb
used memory: 7266.55078125 Mb
used memory: 7266.390625 Mb
used memory: 7272.328125 Mb
used memory: 7265.828125 Mb
used memory: 7265.41015625 Mb
used memory: 7265.54296875 Mb
used memory: 7265.46875 Mb
used memory: 7265.32421875 Mb

@jsimsa
Copy link
Contributor

jsimsa commented Nov 19, 2020

@federicoruggeri can you reproduce this issue in a colab? I cannot reproduce the issue in my environment.

@federicoruggeri
Copy link

federicoruggeri commented Nov 20, 2020

@federicoruggeri can you reproduce this issue in a colab? I cannot reproduce the issue in my environment.

I've tried the colab session that you've linked above, but I'm not able to reproduce the issue there. My initial guess was that the colab runtime was using tensorflow==2.3 (no gpu) but the same configuration does not work for me. Just to be sure about that, I've created a virtualenv from scratch with just tensorflow==2.3 and python 3.5.0. Running the same toy script does show the memory leak issue.

Therefore, I don't know if the problem does not show in the colab session due to some additional package that is installed there. Could the python version mean something here? I'm a bit sceptic about this since @sehoffmann was using python 3.6.9 (yet another version).

@bhack
Copy link
Contributor

bhack commented Nov 20, 2020

@federicoruggeri can you try @jsimsa script in an official Tensorflow Docker image?

@federicoruggeri
Copy link

Sorry for the late reply!

I've tried running the script in the following docker tensorflow image: tensorflow/tensorflow:latest-gpu-jupyter
I don't know if the selected image is good for testing (if it is not the case, which one should I try?). The selected docker image runs tensorflow-gpu==2.3.1.
Running the test script on CPU, gives the following results:

CPU, no shuffle:
used memory: 5913.8671875 Mb
used memory: 5958.3046875 Mb
used memory: 5976.640625 Mb
used memory: 5983.40234375 Mb
used memory: 5986.78125 Mb
used memory: 5912.99609375 Mb
used memory: 5957.484375 Mb
used memory: 5976.9375 Mb
used memory: 5984.3203125 Mb
used memory: 6001.578125 Mb
used memory: 5988.734375 Mb
used memory: 5988.7265625 Mb
used memory: 5988.8046875 Mb
used memory: 6007.3828125 Mb
used memory: 5988.41796875 Mb
used memory: 5988.41015625 Mb
used memory: 5988.34765625 Mb

CPU, shuffle:
used memory: 7384.109375 Mb
used memory: 7432.59765625 Mb
used memory: 7482.33984375 Mb
used memory: 7532.17578125 Mb
used memory: 7583.8671875 Mb
used memory: 7633.65234375 Mb
used memory: 7681.5234375 Mb
used memory: 7731.34375 Mb
used memory: 7780.64453125 Mb
used memory: 7830.98046875 Mb
used memory: 7791.765625 Mb
used memory: 7801.609375 Mb
used memory: 7850.3828125 Mb
used memory: 7899.046875 Mb
used memory: 7948.2890625 Mb
used memory: 7997.28515625 Mb
used memory: 8047.5390625 Mb
used memory: 8097.25390625 Mb
used memory: 8145.54296875 Mb
used memory: 8194.12109375 Mb

As you can see, enabling shuffles causes the same memory leak issue.

@bhack
Copy link
Contributor

bhack commented Nov 26, 2020

Can you check also with tensorflow/tensorflow:2.4.0rc3-gpu?

@federicoruggeri
Copy link

Here you are!

CPU, no shuffle:
used memory: 6489.3828125 Mb
used memory: 6527.87109375 Mb
used memory: 6556.4140625 Mb
used memory: 6584.17578125 Mb
used memory: 6490.6875 Mb
used memory: 6534.18359375 Mb
used memory: 6562.65234375 Mb
used memory: 6590.45703125 Mb
used memory: 6499.765625 Mb
used memory: 6534.37109375 Mb
used memory: 6562.42578125 Mb
used memory: 6590.02734375 Mb
used memory: 6559.4296875 Mb
used memory: 6546.87890625 Mb
used memory: 6563.83984375 Mb
used memory: 6591.390625 Mb
used memory: 6559.734375 Mb
used memory: 6534.88671875 Mb
used memory: 6564.5 Mb
used memory: 6591.3359375 Mb

CPU, shuffle:
used memory: 8369.921875 Mb
used memory: 8429.8828125 Mb
used memory: 8466.77734375 Mb
used memory: 8519.40625 Mb
used memory: 8568.71484375 Mb
used memory: 8616.8203125 Mb
used memory: 8665.1015625 Mb
used memory: 8723.90625 Mb
used memory: 8763.6171875 Mb
used memory: 8812.03125 Mb
used memory: 8652.1171875 Mb
used memory: 8692.453125 Mb
used memory: 8741.24609375 Mb
used memory: 8790.6875 Mb
used memory: 8841.984375 Mb
used memory: 8897.66796875 Mb
used memory: 8939.43359375 Mb
used memory: 8989.12109375 Mb
used memory: 9038.546875 Mb
used memory: 9088.08984375 Mb

@bhack
Copy link
Contributor

bhack commented Nov 26, 2020

Do you have an updated Nvidia driver?

@federicoruggeri
Copy link

Info:
NVIDIA-SMI 455.45.01 Driver Version: 455.45.01 CUDA Version: 11.1

I've tried also the 450 driver

Is it ok?

@bhack
Copy link
Contributor

bhack commented Nov 26, 2020

It Is strange that It Is GPU only. Can you try to give a run with https://www.tensorflow.org/api_docs/python/tf/config/experimental/set_memory_growth

@federicoruggeri
Copy link

@bhack Actually the problem seems to not related to the device. I've tested tensorflow-gpu (different versions) with and without GPU device, as well as standard tensorflow.

As you suggested, I've also tried by enabling memory growth (that's what I usually do) but the memory leak still appears.

The strange thing is that the same code on the colab session works fine. I don't know if it is a combination of tensorflow packages (and their versions) that does the trick..

@bhack
Copy link
Contributor

bhack commented Nov 27, 2020

Yes It was very strange if It was related to the GPU package. The problem is the Colab has its own build from soruce.
So we are not sure that in Docker or Wheels we are the Colab build.

Can you try on Colab with pip install tf-nightly?

@federicoruggeri
Copy link

federicoruggeri commented Nov 27, 2020

Here's the link to the colab session: https://colab.research.google.com/drive/1MKQmTbly7BxSJVxEjlgdO-ZpRsVK0RhJ?usp=sharing

I'm not sure I've done eveything correctly (debug print messages seem ok to me): running !pip install tf-nightly for the first time requires restarting the runtime. After that, I think the update is up.

For what concerns the test script, it runs fine without any memory issue.

@jsimsa
Copy link
Contributor

jsimsa commented Feb 23, 2021

I have recently investigated the memory growth observed for OSS version of TensorFlow when shuffle is used. The conclusion of my investigation is that the memory growth is because of poor performance of the memory allocator (TensorFlow OSS uses system malloc by default). In my experiments, switching to use TCMalloc (details below) resulted in constant memory usage (and program speedup).

For the evaluation, I used the following simple input pipeline:

import tensorflow as tf
import psutil

dataset = tf.Dataset.range(int(1e7))
iterator = dataset.shuffle(int(1e7)).batch(int(1e6))

for _ in iterator:
  used_mem = psutil.virtual_memory().used
  print("used memory: {} Mb".format(used_mem / 1024 / 1024))

When executed on workstation, it produces the following output:

$ python example.py

used memory: 19853.52734375 Mb
used memory: 19905.6484375 Mb
used memory: 19958.109375 Mb
used memory: 20014.796875 Mb
used memory: 20064.8359375 Mb
used memory: 20061.375 Mb
used memory: 20117.23828125 Mb
used memory: 20172.8515625 Mb
used memory: 20228.18359375 Mb
used memory: 20278.62890625 Mb

I then installed tcmalloc using sudo apt-get install libtcmalloc-minimal4 and used it for the same program, as follows:

$ LD_PRELOAD=/path/to/libtcmalloc_minimal.so.4 python example.py

used memory: 19291.0859375 Mb
used memory: 19307.90234375 Mb
used memory: 19315.859375 Mb
used memory: 19315.875 Mb
used memory: 19317.8671875 Mb
used memory: 19311.14453125 Mb
used memory: 19317.3515625 Mb
used memory: 19317.34765625 Mb
used memory: 19316.96484375 Mb

Not only the gradual memory growth disappeared, but the program also ran 2x faster.

@jsimsa jsimsa closed this as completed Feb 23, 2021
@bhack
Copy link
Contributor

bhack commented Feb 23, 2021

Is this about a specific glibc version?

@bhack
Copy link
Contributor

bhack commented Feb 23, 2021

Also I don't know if we could pilot some specific tuning with mallopt e.g. M_ARENA_MAX

@ghwatson
Copy link

Independently arrived at a similar memory issue in a training situation I'm working on. In my case, we had a lot of RAM, and we noticed that after 3 or so epochs, it no longer continued incrementing.

After swapping to the malloc library above, from the start we had it staying constant! Thanks @jsimsa for posting your fix! Is this dependency issue even mentioned anywhere in the TF docs?

@bhack
Copy link
Contributor

bhack commented Feb 24, 2021

Independently arrived at a similar memory issue in a training situation I'm working on. In my case, we had a lot of RAM, and we noticed that after 3 or so epochs, it no longer continued incrementing.

After swapping to the malloc library above, from the start we had it staying constant! Thanks @jsimsa for posting your fix! Is this dependency issue even mentioned anywhere in the TF docs?

What Is your glibc version?

@ghwatson
Copy link

2.27-3ubuntu1

@bhack
Copy link
Contributor

bhack commented Feb 24, 2021

2.27-3ubuntu1

It could be nice to test this with a more recent glibc version

@jsimsa
Copy link
Contributor

jsimsa commented Feb 24, 2021

2.27-3ubuntu1

It could be nice to test this with a more recent glibc version

My experiments used Debian GLIBC 2.31-9.

@bhack
Copy link
Contributor

bhack commented Feb 25, 2021

@jsimsa Can you reproduce the memory growing in your example prefix python with the env M_CHECK_=1?

@jsimsa
Copy link
Contributor

jsimsa commented Feb 25, 2021

@bhack Unfortunately, I will not have cycles to investigate this further in the near future.

@bhack
Copy link
Contributor

bhack commented Feb 25, 2021

Ok just to confirm that I cannot reproduce your example with M_CHECK_=1

@azzeddineCH
Copy link

Hi @jsimsa, So I tried your solution which solved my memory problem but it's 2x slower (TF version: 2.4.0). is there any fix planned to this issue in the upcoming releases ?

@michaelschufi
Copy link

Any tips on what to do if the tcmalloc LD_PRELOAD only works occasionally?

  1. I ran the command with the mentioned library LD_PRELOAD="/lib/x86_64-linux-gnu/libtcmalloc_minimal.so.4" python script.py and it worked.
  2. I interrupted the run with CTRL+C.
  3. I started the same run again, with the exact same command line, but this time it didn't work.

It only worked 3 or 4 times so far (out of maybe 50 runs).

Using Ubuntu 20.04 amd64.

@cournape
Copy link

This may be related to how glibc works for smaller allocations, the ones that are not mmaped. IIUC, glibc free does not actually return the memory to the system in those cases. E.g. if you run this

import tensorflow as tf
import psutil

dataset = tf.Dataset.range(int(1e7))
iterator = dataset.shuffle(int(1e7)).batch(int(1e6))

for _ in iterator:
  used_mem = psutil.virtual_memory().used
  print("used memory: {} Mb".format(used_mem / 1024 / 1024))

and run as follows

# See glibc doc for MALLOC_TRIM_THRESHOLD_. Quoting:
# The value of this tunable is the minimum size (in bytes) of the 
# top-most, releasable chunk in an arena that will trigger a system 
# call in order to return memory to the system from that arena.
$ MALLOC_TRIM_THRESHOLD_=0 python foo.py
[snip]
used memory: 2092.2265625 Mb
used memory: 2099.8515625 Mb
used memory: 2099.80859375 Mb

the leak disappears. Forcing mmap everywhere also "works"

MALLOC_MMAP_THRESHOLD_=0 python foo.py
[snip]
used memory: 2340.01953125 Mb
used memory: 2347.640625 Mb
used memory: 2355.515625 Mb
used memory: 2363.14453125 Mb

Using tcmalloc is still ~2x faster however.

@cournape
Copy link

This may explain the issue we're seeing here: https://blog.cloudflare.com/the-effect-of-switching-to-tcmalloc-on-rocksdb-memory-use/.

@Aryavui
Copy link

Aryavui commented Jun 27, 2022

it still useless

@Aryavui
Copy link

Aryavui commented Jun 28, 2022

sorry, i try it again, it indeed works.

Sign up for free to join this conversation on GitHub. Already have an account? Sign in to comment
Labels
comp:data tf.data related issues TF 2.3 Issues related to TF 2.3 type:performance Performance Issue
Projects
None yet
Development

No branches or pull requests