Skip to content
New issue

Have a question about this project? Sign up for a free GitHub account to open an issue and contact its maintainers and the community.

By clicking “Sign up for GitHub”, you agree to our terms of service and privacy statement. We’ll occasionally send you account related emails.

Already on GitHub? Sign in to your account

Tensorflow operations : Invalid data type according to Tensorflow Profiler #45946

Open
RocaVincent opened this issue Dec 23, 2020 · 12 comments
Open
Assignees
Labels
comp:gpu GPU related issues comp:tensorboard Tensorboard related issues stat:awaiting tensorflower Status - Awaiting response from tensorflower TF 2.4 for issues related to TF 2.4 type:bug Bug

Comments

@RocaVincent
Copy link

Hi,

I use Tensorflow 2.5 installed from source with Cuda 11.1 and Cudnn 8 on Ubuntu 20.04. My GPU is a Nvidia Quadro RTX 6000.

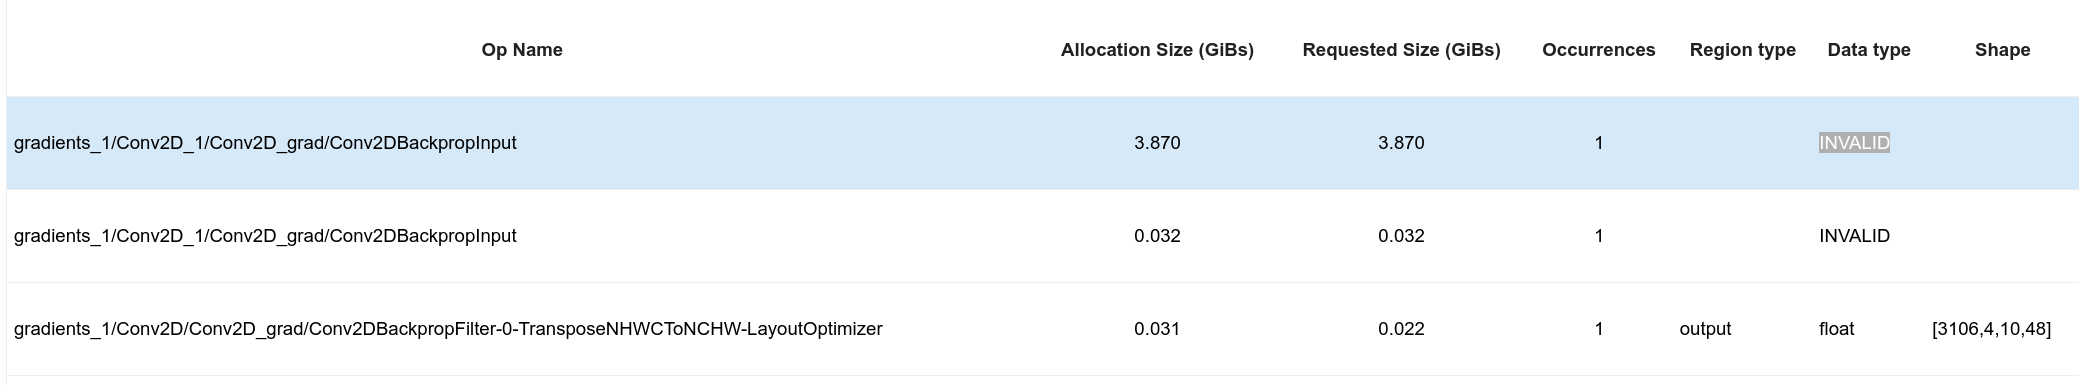
I have got Out of Memory problems with the GPU and the training of a CycleGAN model. In order to track memory leaks in my code, I have run it with profiler trace and I can now see with Tensorboard strange results in the memory breakdown table (memory profile tab). Indeed, some Tensorflow operations have "INVALID" data type, no region type and no shape. This suggests there are bugs with some Tensorflow operations.

Above I put a minimal code sample which reproduces this kind of error.

import tensorflow as tf
import keras

IMAGE_SHAPE = [256,256,3]

def Discriminator():
    return keras.Sequential([
        keras.layers.Flatten(input_shape=IMAGE_SHAPE),
        keras.layers.Dense(1, activation="sigmoid")
    ])

def Generator():
    return keras.Sequential([
        keras.layers.Conv2D(filters=IMAGE_SHAPE[-1], kernel_size=3, strides=1, padding="same", use_bias=False,
                           input_shape=IMAGE_SHAPE)
    ])

generator_BtoA = Generator()
discriminator_A = Discriminator()

loss_obj = keras.losses.MeanSquaredError()

discriminator_A_optimizer = keras.optimizers.Adam(0.0002)

BATCH_SIZE = 32

@tf.function
def train_step():
    # training discriminator
    imagesA = tf.random.uniform([BATCH_SIZE]+IMAGE_SHAPE)
    imagesB = tf.random.uniform([BATCH_SIZE]+IMAGE_SHAPE)
    fakesA = generator_BtoA(imagesB, training=False)
    with tf.GradientTape(persistent=True) as tape:
        disc_fakesA = discriminator_A(fakesA, training=True)
        discA_loss = loss_obj(tf.zeros_like(disc_fakesA), disc_fakesA)
    gradients_discA = tape.gradient(discA_loss, discriminator_A.trainable_variables)
    discriminator_A_optimizer.apply_gradients(zip(gradients_discA, discriminator_A.trainable_variables))


from tensorflow.profiler.experimental import Trace as Trace_profiler, start as start_profiler, stop as stop_profiler

start_profiler("my_logdir/")
with Trace_profiler("train", step_num=1, _r=-1):
    train_step()
stop_profiler()

With this code, I get the following results in the memory profile tab :

Op Name Allocation Size (GiBs) Requested Size (GiBs) Occurrences Region type Data type Shape
sequential/conv2d/Conv2D 0.227 0.227 1   INVALID
sequential/conv2d/Conv2D 0.039 0.039 1   INVALID
sequential/conv2d/Conv2D 0.023 0.023 1 output float [32,3,256,256]
sequential/conv2d/Conv2D-0-TransposeNHWCToNCHW-LayoutOptimizer 0.023 0.023 1 output float [32,3,256,256]

How do you interprete these results ?

@amahendrakar
Copy link
Contributor

@RocaVincent,

I have got Out of Memory problems with the GPU and the training of a CycleGAN model.

To resolve the out of memory error, please try any one of the methods to limit GPU memory as shown in this guide.

Also, please go through these guides for tensorboard profiling tool and memory profile summary for more information. Thanks!

@amahendrakar amahendrakar added comp:gpu GPU related issues stat:awaiting response Status - Awaiting response from author TF 2.4 for issues related to TF 2.4 type:support Support issues and removed type:bug Bug labels Dec 24, 2020
@RocaVincent
Copy link
Author

@amahendrakar

To resolve the out of memory error, please try any one of the methods to limit GPU memory as shown in this guide.

I have already tried to allow memory growthing but there is still the problems.

Also, please go through these guides for tensorboard profiling tool and memory profile summary for more information.

That's what I've done and that's what I've explained in the first post with in addition a minimal code sample to reproduce the results with the profiler, you may have missed it.

I'm curious to know if people get the same results with this code (run the code and access the dir my_logdir with the profiler).

@tensorflowbutler tensorflowbutler removed the stat:awaiting response Status - Awaiting response from author label Dec 26, 2020
@amahendrakar
Copy link
Contributor

I did not face any out of memory errors on running the code, however I did get similar results with the memory profiler on TF v2.3, TF v2.4 and TF-nightly. Please find the gist of it here.

Screenshot 2020-12-24 at 11 18 40 PM

Thanks!

@amahendrakar amahendrakar added the comp:tensorboard Tensorboard related issues label Dec 27, 2020
@rmothukuru
Copy link
Contributor

@RocaVincent,
Can you please respond to the above comment? Thanks!

@rmothukuru rmothukuru added the stat:awaiting response Status - Awaiting response from author label Jan 4, 2021
@RocaVincent
Copy link
Author

@rmothukuru
My issue is about the strange results that the profiler gives with this convolutions with invalid data type, no shape and no region type. Of course, I haven't OOM errors with this simple code either, but it points out some problems which may cause OOM with bigger models.

@rmothukuru rmothukuru assigned bmd3k and unassigned rmothukuru Jan 5, 2021
@rmothukuru rmothukuru added stat:awaiting tensorflower Status - Awaiting response from tensorflower type:bug Bug and removed stat:awaiting response Status - Awaiting response from author type:support Support issues labels Jan 5, 2021
@ckluk-github
Copy link

Hi,
I think I replied you regarding this issue in tensorflow/profiler#255
We are still investigating (delayed due to the holidays).
thanks

@bmd3k bmd3k assigned ckluk-github and unassigned bmd3k Jan 8, 2021
@tinducvo
Copy link

I have this issue with Conv1D also. My model should be using under 200MB, but I have INVALID shape when profiling and the heap usage spikes to 4GB.

@sushreebarsa
Copy link
Contributor

Was able to replicate the issue in TF v2.5,please find the gist here..Thanks !

@bastienjalbert
Copy link

bastienjalbert commented Sep 19, 2021

I have this issue with Conv1D also. My model should be using under 200MB, but I have INVALID shape when profiling and the heap usage spikes to 4GB.

Got almost exactly the same. With Conv2D. It causes that 4go of memory are fried, even if the network need no more than 200Mo to run...

image
image

Does anybody have found a solution or an idea of that ?

@xsqian
Copy link

xsqian commented Oct 24, 2021

I am running TensorFlow 2.4.3 and see the same issue. Has anybody found a solution or an idea for this issue?
image

@yichunkuo-pony
Copy link

Has similar issue, any update? @ckluk-github

@isabellahuang
Copy link

Running into the same issue as well.

Sign up for free to join this conversation on GitHub. Already have an account? Sign in to comment
Labels
comp:gpu GPU related issues comp:tensorboard Tensorboard related issues stat:awaiting tensorflower Status - Awaiting response from tensorflower TF 2.4 for issues related to TF 2.4 type:bug Bug
Projects
None yet
Development

No branches or pull requests