srsinst.rga provides Python instrument classes to control and acquire mass spectra from
Stanford Research Systems (SRS) Residual Gas Analyzers (RGA).
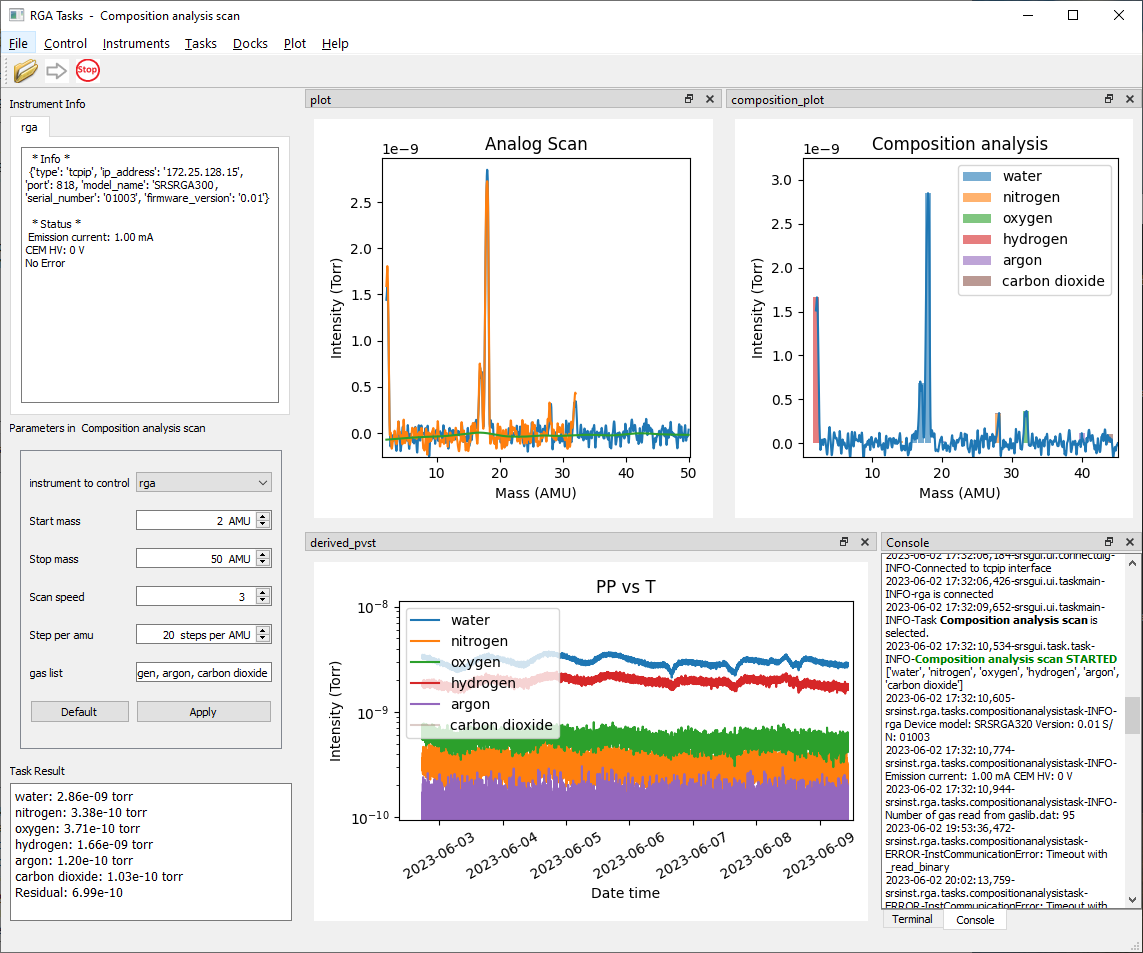
It also provides tasks running in graphic user interface (GUI) environment based on
srsgui.
For safe operation of an SRS RGA with this package, familiarize yourself with the RGA
manual and
the srsinst.rga documentation.
You need a working Python version 3.7 or later with pip (Python package installer) installed.
If you don't, install Python 3 to your system.
To use its full GUI application, create a virtual environment, if necessary,
and run Python package installer pip with [full] option from the command prompt.
# To create a simple virtual environment (Optional)
# The activate command may differ depending on your computer operating systems.
# Following is for Windows.

python -m venv venv
venv\scripts\activate

# To install full GUI application

python -m pip install srsinst.rga[full]
To install srsinst.rga as an instrument driver only, install WITHOUT the [full] option.
Installation will be faster, because it does NOT install GUI related packages.
python -m pip install srsinst.rga
To upgrade srsinst.rga to the latest version available, run pip with --upgrade argument.
python -m pip install --upgrade srsinst.rga
If the Python Scripts directory is in PATH environment variable, Start the application by typing from the command line:
rga
If not,
python -m srsinst.rga
It will start the GUI application.
- Connect to an RGA from the Instruments menu.
- Select a task from the Task menu.
- Press the apply button, if you change parameters of the task.
- Press the green arrow button to run the selected task.
You can write your own task or modify an existing one and run it from the application. Refer to Custom tasks section in the documentation for details.
-
Start the Python program, or an editor of your choice to write a Python script.
-
import the RGA100 class from
srsinst.rgapackage. -
Instantiate RGA100 to connect to an SRS RGA.
from srsinst.rga import RGA100 # for TCPIP communication ip_address = '192.168.1.100' user_id = 'admin' password = 'admin' rga1 = RGA100('tcpip', ip_address, user_id, password) # for serial communication # Baud rate for RGA100 is fixed to 28800 # rga2 = RGA('serial', /dev/ttyUSB0', 28800) # for Linux serial communication rga2 = RGA('serial', 'COM3', 28800) # for Windows serial communication # or initialize a RGA100 instance without connection, then connect. rga3 = RGA100() rga3.connect('tcpip', ip_address, user_id, password) -
Control ionizer parameters.
# Set ionizer values rga1.ionizer.electron_energy = 70 rga1.ionizer.ion_energy = 12 rga1.ionizer.focus_voltage = 90 # or rga1.ionizer.set_parameters(70, 12, 90) # Get the ionizer parameters a = rga1.ionizer.electron_energy b = rga1.ionizer.ion_energy c = rga1.ionizer.focus_voltage # or a, b, c = rga1.ionizer.get_parameters() # Set the filament emsission current. rga1.ionizer.emission_current = 1.0 # in the unit of mA rga1.ionizer.emission_current = 0.0 # It will turn off the filament. # or rga1.filament.turn_on() # Turn on with the default emission cureent of 1 mA. rga1.filament.turn_off() # Read back the emission current a = rga1.ionizer.emission_current -
Control detector parameters.
# Set CEM voltage to the calibrated CEM voltage, or 0 to turn off rga1.cem.voltage = rga1.cem.stored_voltage rga1.cem.voltage = 0 # or simply turn on or off rga1.cem.turn_on() rga1.cem.turn_off() # Read back CEM voltage setting a = rga1.cem.voltage -
Control scan parameters.
# Set scan parameters rga1.scan.initial_mass = 1 rga1.scan.final_mass = 50 rga1.scan.scan_speed = 3 rga1.scan.resolution = 10 # steps_per_amu # or rga1.scan.set_parameters(1, 50, 3, 10) # Get scan parameters mi, mf, nf, sa = rga1.scan.get_parameters() -
Run an analog scan.
analog_spectrum = rga1.scan.get_analog_scan() spectrum_in_torr = rga1.scan.get_partial_pressure_corrected_spectrum(analog_spectrum) # Get the matching mass axis with the spectrum analog_mass_axis = rga1.scan.get_mass_axis(True) # is it for analog scan? Yes. -
Run a histogram scan.
histogram_spectrum = rga1.scan.get_histogram_scan() # Get the matching mass axis with the spectrum histogram_mass_axis = rga1.get_mass_axis(False) # is it for analog scan? No. -
Run a PvsT scan.
masses_of_choice = [2, 18, 28, 32, 44] intensities = rga1.scan.get_multiple_mass_scan(masses_of_choice) -
Measure a single mass ion current of nitrogen at 28 amu
intensity = rga1.scan.get_single_scan(28) -
Save the spectrum to a file.
with open('spectrum.dat', 'w') as f: for x, y in zip(analog_mass_axis, analog_spectrum): f.write('{:.2f} {:.4e}\n'.format(x, y)) -
Plot with matplotlib.
  import matplotlib.pyplot as plt
  plt.plot(analog_mass_axis, spectrum_in_torr)
  plt.show()