Transition_reveal for both points and geom_smooth #209
Comments
|
Column |
|
Edit your first post above with a |
|
I think this is similar to something I'm trying to accomplish now: Static plot = final frame of animation:
Attempt (doesn't work) in
I think it's failing because I think this is a nice animation for showing how points can accumulate to make a distribution. Here's a workaround that's quite slow to render since it quadratically explodes the number of rows in the input:
|

|
I think you should be able to accomplish what you want by giving a unique group aesthetic to each point |
|
Thanks @thomasp85. Could you elaborate? I'm also new to most things |
|
All geoms have a group aesthetic even though it is unused by many. gganimate used it though, in order to figure out which graphic elements are part of the same “entity”. If you do |
|
(assume you mean Hmm, not sure I follow. These both look the same as above to me: Anyway, I'm ~basically fine with how the second one looks (constructing the full "scatter boxplot" gradually), the problem is that it's a bit awkward to create the data to mimic the My aim is to make the first one use |
|
Thanks, I have already got that through this code |
|
@MichaelChirico can you provide a reproducible example... the code you have given produces an error as |
|
@thomasp85 sorry, bad copy-pasting... included in original post here |
|
hmm... I can see that adding a unique group doesn't really alter the output, though it should... I'll look into it |
|
Sorry, I am not so good in writing examples :(
So I get something like this |
|
Ah... I'm messing up my head because I'm currently doing some last minute changes to the transition api's... Setting |
|
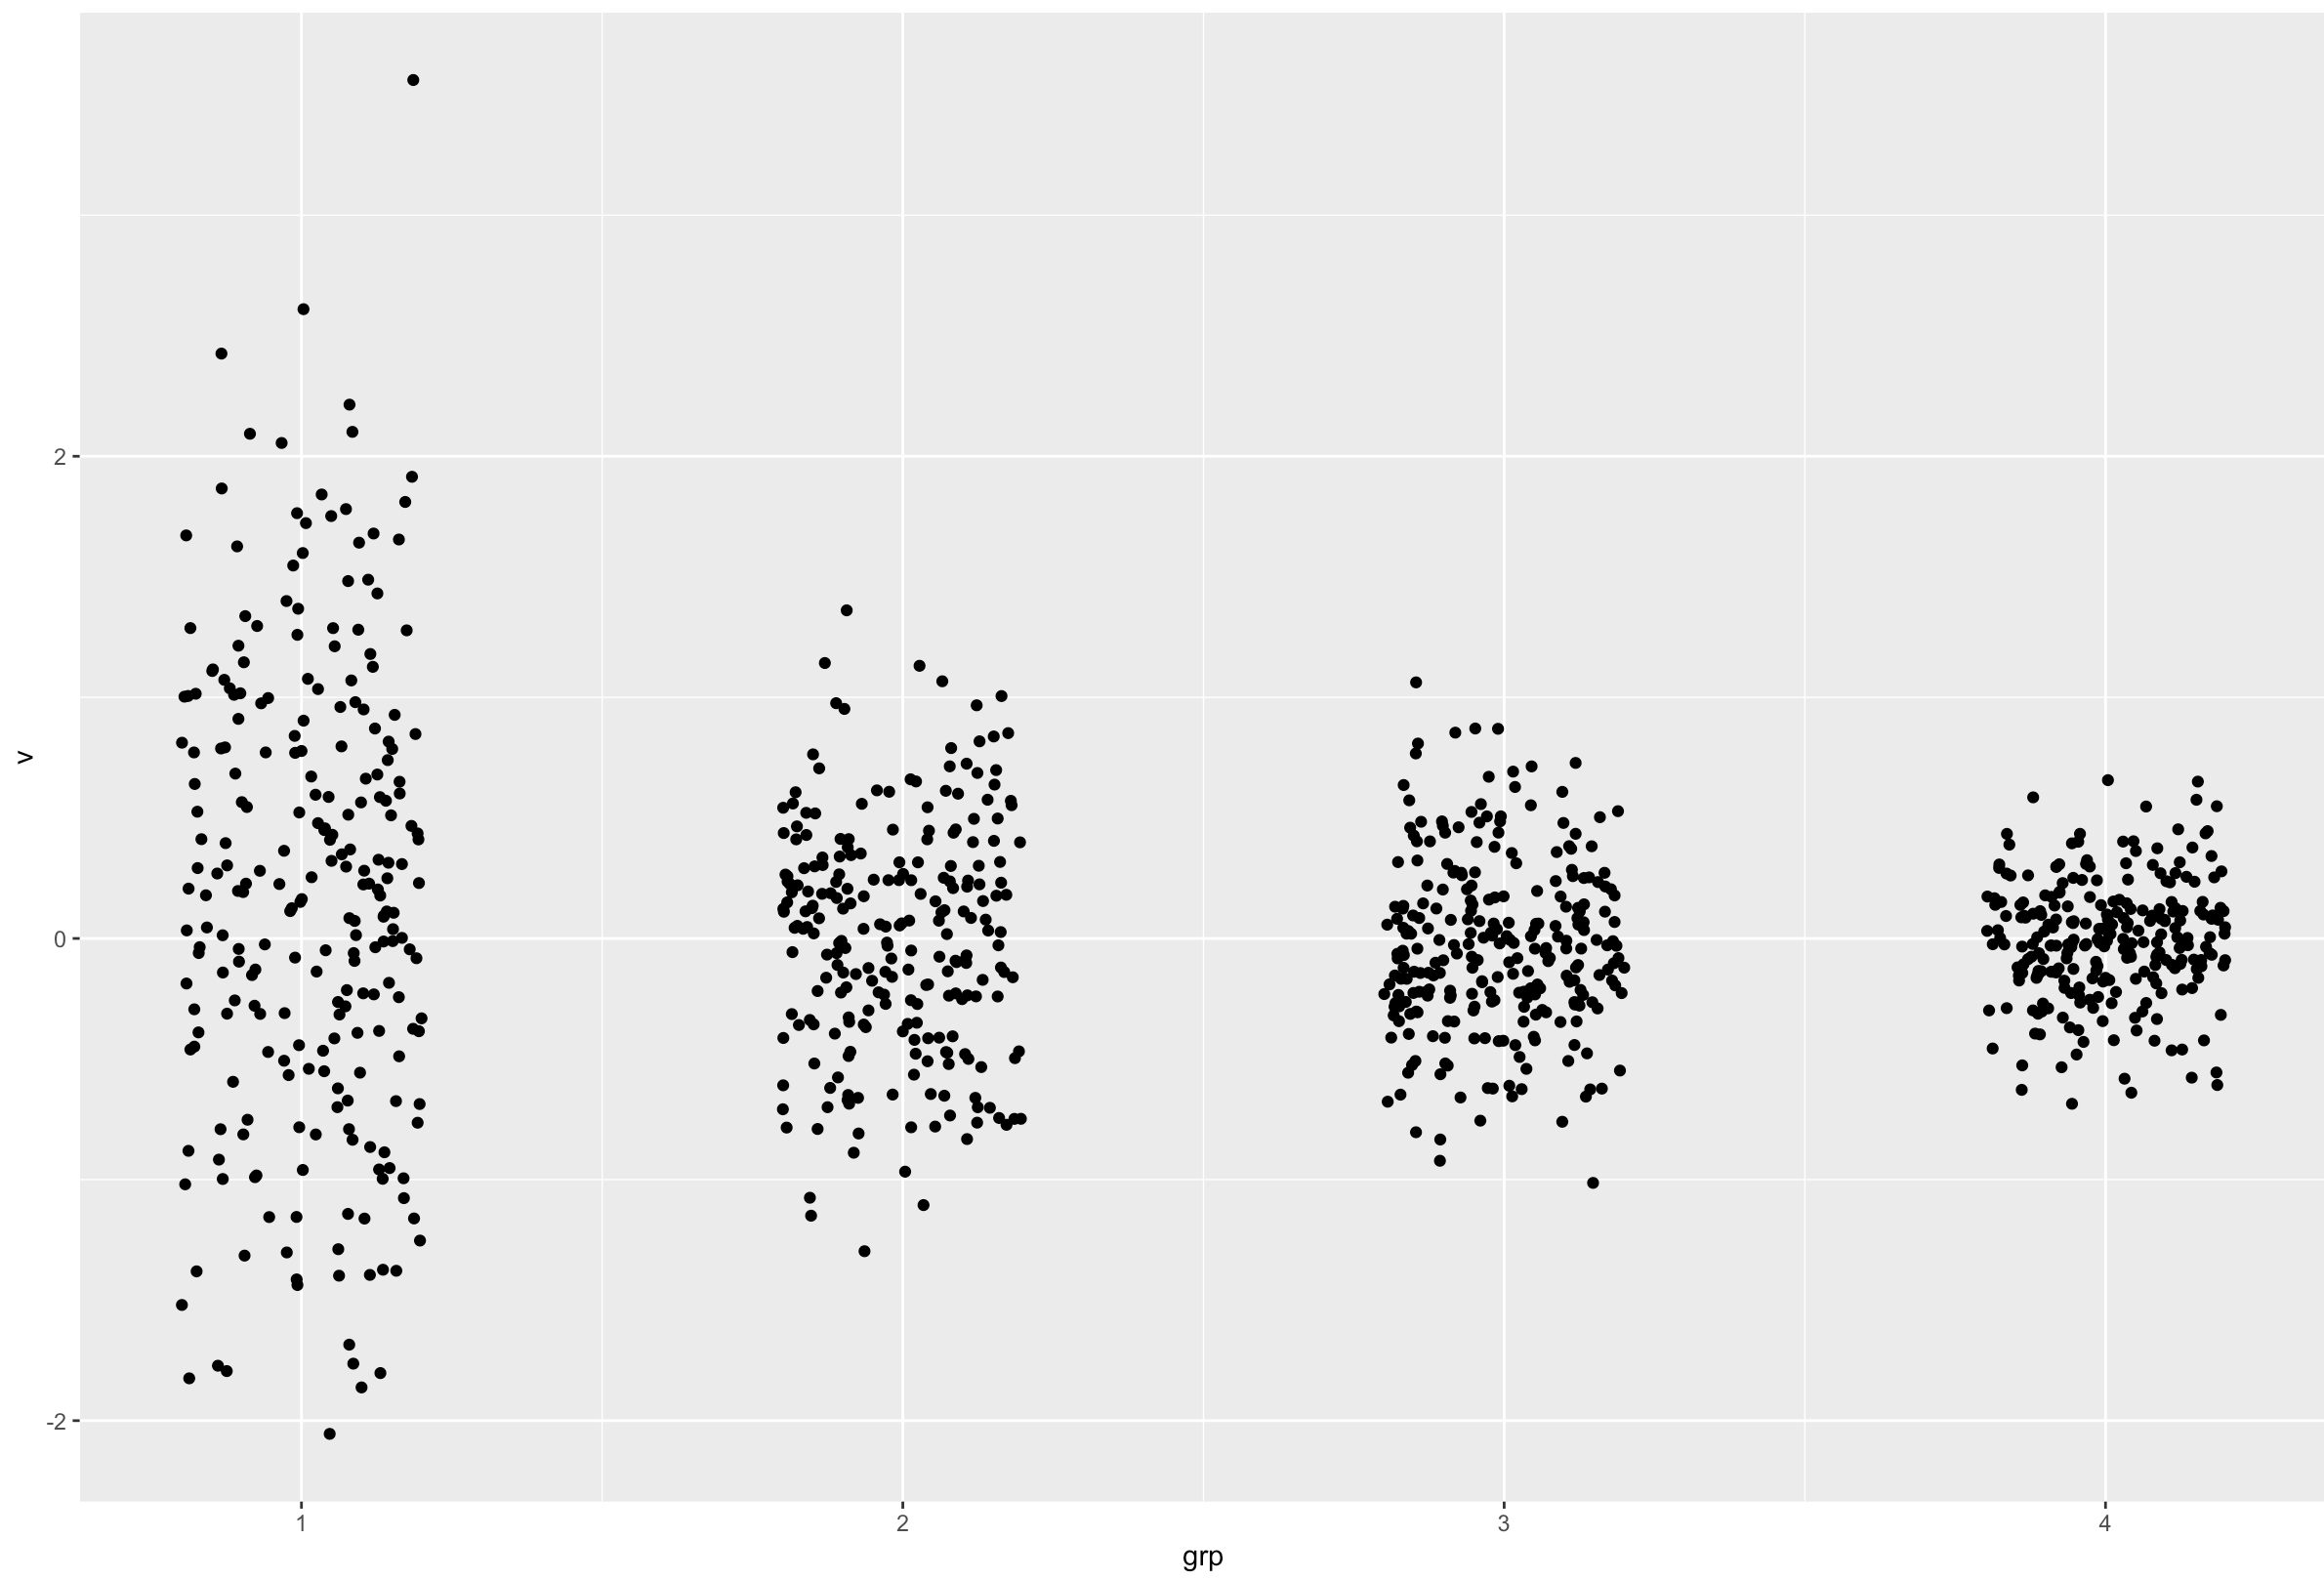
reprex below library(reprex)
library(ggplot2)
library(gganimate)
library(data.table)

DT = data.table(
  grp = sample(4L, 1e3, TRUE)
)
DT[ , v := rnorm(.N, sd = 1/.BY$grp), by = grp]
DT[ , grpI := seq_len(.N), by = grp]
# Example 1
ggplot(DT, aes(grp, v)) +
  geom_jitter(aes(group = seq_along(v)), width = .2) +
  transition_reveal(grp, grpI)
# Example 2
ggplot(DT[DT, .(i.grpI, x.grp, x.v),
          on = .(grpI <= grpI, grp == grp), allow.cartesian = TRUE],
       aes(x.grp, x.v)) +
  geom_jitter(aes(group=seq_along(x.v)), width = .2) +
  transition_states(
    i.grpI,
    transition_length = 1,
    state_length = 2
)Created on 2018-12-10 by the reprex package (v0.2.0). |

|
thanks, looking good! |
ggplot(DT, aes(grp, v)) +
  geom_jitter(width = .2) +
  transition_reveal(seq_along(grp), grpI)
|
|
@thomasp85 looking exactly like I envisioned! love it! excellent! |
|
@MichaelChirico be aware that I will soon deprecate the |
|
@Janzeero your issue is entangled in a lot of stuff that I'm working on right now - a fix will be provided soon |
|
@Janzeero just to be sure - Is this the result you are after? |
|
@MichaelChirico the changes I talked about has been merged and you should now do: ggplot(DT, aes(grp, v, group = seq_along(v))) +
geom_jitter(width = .2) +
transition_reveal(grpI)to get the correct result |
|
I would be curious to know how this was produced with the new API. There are some tutorials online, but they all use the deprecated
|
|
I join the request of @fmmattioni. @thomasp85 could you please provide an example of how to make that last plot? I just also found examples with deprecated API like this. |
|
My last response includes the code |
|
Ok, sorry, I didn't get it! Thanks! |
Where exactly? I only see the code for the scatter plot... Thanks! |
I also am not seeing any code to produce the animated points + smooth chart. When I run this code, I get the following error: ggplot(mtcars, aes(x = mpg, y = hp)) +
geom_point() +
geom_smooth(method = 'loess', formula = 'y ~ x', se = FALSE) +
transition_reveal(mpg) |
Here is a data. I can make through transition_reveal appearing geom_points. Looks nice, but I also wanna add exponential regression and visualise both simultaneously. Transition_reveal makes render neither with both smooth and points, nor with just smooth. Its possible only for geom_points. Whats wrong?
Gif only with geom_point
Static with both point and line
Here is a code and error. Should be exponential visualisation of decomposition process of tree wood, where t - age of sampling, Pt - its density.
gif<-ggplot(data, aes(t,Pt))+geom_point(shape=21, aes(fill=group),col="black",size=3)+stat_smooth(method="nls", data=decay, method.args = list(formula = y~a*exp(-b*x), start = list(a=570,b=2*log(2)/570)), se=F,size=0.5, col="black",linetype="dotted")+transition_reveal(Pt,t)Error:
Error in[.data.frame(df, , c("alpha", "colour", "size", "linetype")) : undefined columns are chosenThank you a lot for any suggestion and attention!
The text was updated successfully, but these errors were encountered: