Home
Welcome to the FFI Call Logger wiki.
This project gathers several tools, all of them are based on the fact that FFI calls execute this method: TFSameThreadRunner>>#invokeFunction:withArguments:.
This project instruments such method using Reflectivity metalink to emit a Beacon signal on each FFI call.
All running Beacon loggers for that signal can record it.
Following sections show provided tools (or UIs) for watching these recordings.
Note: for the moment this is only implemented for TFSameThreadRunner.
The call logger is a tool that records all calls that are not filtered. More detailed explanation below.
Instrument the FFI calls with:
TFLSignal install.
There is a singleton logger instance. Access it via:
TFLCallLogger instance.
The signals are emitted but only recorded when the logger is started. Control this state with:
TFLCallLogger start.
TFLCallLogger stop.
The logger has a circular collection that discards old signals when is full and new signals are recorded.
Use TFLCallLogger instance entryCount: 20000 to change the limit.
The singleton instance can be nil-ed via:
TFLCallLogger resetInstance.
Note: The singleton is handy but TFLCallLogger new is available to use.
Check the filters protocol that allow avoiding record unwanted calls.
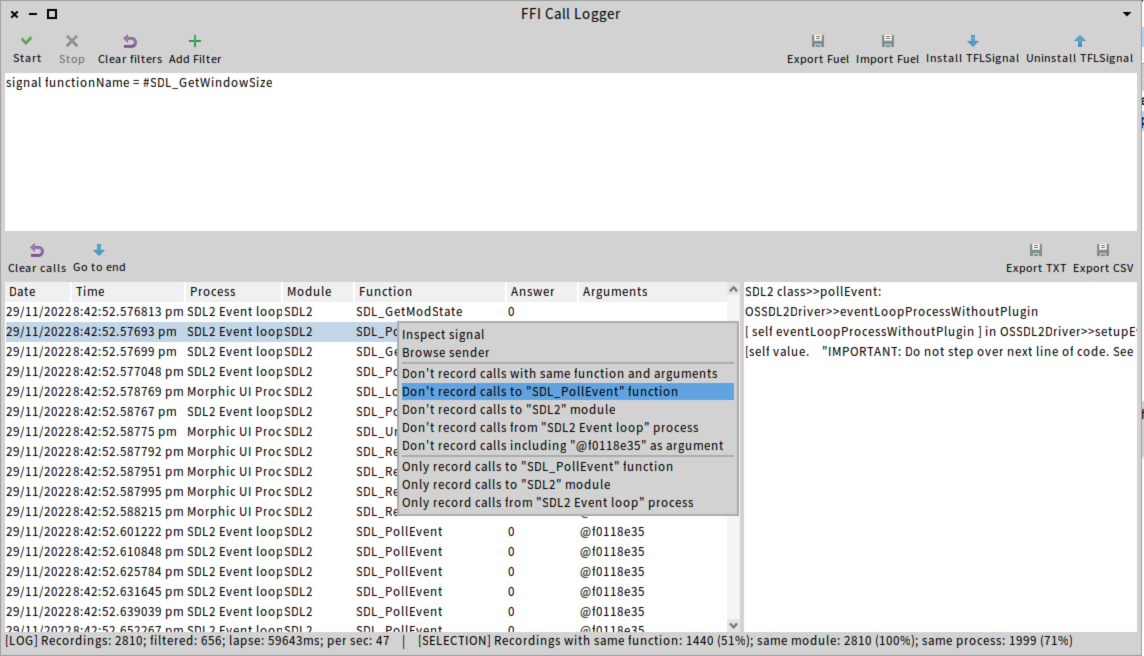
This is our most elaborated UI. It can be opened with: TFLMainPresenter open.
Make sure you click on "Install" button in the toolbar, and then click on "Start".
The recorded calls will start to appear on the bottom left table.
User can right-click on a call to perform several actions. One of them is filtering, which can be useful since Pharo makes calls very frequently to SDL2, Freetype and Cairo and user might not be interested in all of them.
When user left-clicks on a call in the table, the call stack the led to that call appears at the right.
The TFLCallsPerSecondTracer is a tool that, when running, it clears Transcript each second and prints a table with the FFI calls called in last second, with frequency. Example:
| #                 | calls/s |
|-------------------|---------|
| SDL_GetWindowSize |  647.35 |
| SDL_PollEvent     |  175.82 |
| SDL_GetModState   |   19.98 |
| SDL_RenderPresent |    5.99 |
| SDL_RenderCopy    |    5.99 |
| SDL_LockTexture   |    3.00 |
| SDL_UnlockTexture |    3.00 |
| SDL_GetMouseState |    2.00 |
| SDL_FreeCursor    |    1.00 |
| SDL_SetCursor     |    1.00 |
| SDL_CreateCursor  |    1.00 |
Open Transcript and evaluate:
t := TFLCallsPerSecondTracer new.
t start.
When you are done, evaluate t stop.
There is a tool to list the FFI calls performed on image startup.
Easy steps to use it:
- Open the Pharo image from a terminal.
- Customize
TFLSessionCallsLogger class>>#scriptandTFLSessionCallsLogger>>#shouldLog:. - Evaluate
TFLSessionCallsLogger prepareAndQuitto start recording and quit the image. - Copy the
pharo-uicommand written on stdout. - Paste and execute it on the terminal.
- Check a file that is created on the current working directory, with the recorded calls.
Evaluate in Pharo 10 or 11:
Metacello new
    baseline: 'FFICallLogger';
    repository: 'github://tinchodias/FFICallLogger';
    load.