

This is a implementation of handy metrics library for high loaded Golang application with export to prometheus (passive export) and/or to StatsD (active export). But the primary method is the passive export (a special page where somebody get fetch all the metrics).
(and request rate by measuring the rate of the count):
metrics.Count(`requests`, metrics.Tags{
    `method`: request.Method,
}).Increment()startTime := time.Now()
[... do your routines here ...]
metrics.TimingBuffered(`latency`, nil).ConsiderValue(time.Since(startTime))import "github.com/trafficstars/statuspage"
func sendMetrics(w http.ResponseWriter, r *http.Request) {
statuspage.WriteMetricsPrometheus(w)
}
func main() {
[...]
http.HandleFunc("/metrics.prometheus", sendMetrics)
[...]
}import (
"github.com/trafficstars/metrics"
)
func newStatsdSender(address string) (*statsdSender, error) {
[... init ...]
}
func (sender *statsdSender) SendInt64(metric metrics.Metric, key string, int64) error {
[... send the metric to statsd ...]
}
func (sender *statsdSender) SendUint64(metric metrics.Metric, key string, uint64) error {
[... send the metric to statsd ...]
}
func (sender *statsdSender) SendFloat64(metric metrics.Metric, key string, float64) error {
[... send the metric to statsd ...]
}
func main() {
[...]
metricsSender, err := newStatsdSender(`localhost:8125`)
if err != nil {
log.Fatal(err)
}
metrics.SetSender(metricsSender)
[...]
}(the buffer should be implemented on the sender side if it's required)
package main

import (
        "fmt"
        "math/rand"
        "net/http"
        "time"

        "github.com/trafficstars/metrics"
        "github.com/trafficstars/statuspage"
)

func hello(w http.ResponseWriter, r *http.Request) {
    answerInt := rand.Intn(10)

    startTime := time.Now()

    // just a metric
    tags := metrics.Tags{`answer_int`: answerInt}
    metrics.Count(`hello`, tags).Increment()

    time.Sleep(time.Millisecond)
    fmt.Fprintf(w, "Hello world! The answerInt == %v\n", answerInt)

    // just a one more metric
    tags["endpoint"] = "hello"
    metrics.TimingBuffered(`latency`, tags).ConsiderValue(time.Since(startTime))
}

func sendMetrics(w http.ResponseWriter, r *http.Request) {
	startTime := time.Now()

    statuspage.WriteMetricsPrometheus(w)

    metrics.TimingBuffered(`latency`, metrics.Tags{
		"endpoint": "sendMetrics",
    }).ConsiderValue(time.Since(startTime))
}

func main() {
    http.HandleFunc("/", hello)
    http.HandleFunc("/metrics.prometheus", sendMetrics) // here we export metrics for prometheus
    http.ListenAndServe(":8000", nil)
}The same as above, but just use our handler:
// import "github.com/trafficstars/statuspage/handler/echostatuspage"

r := echo.New()
r.GET("/status.prometheus", echostatuspage.StatusPrometheus)
Aggregative metrics are similar to prometheus' summary. There're available three methods of summarizing/aggregation of observed values:
- Simple.
- Flow.
- Buffered.
There's two types of Aggregative metrics:
- Timing (receives
time.Durationas the argument to methodConsiderValue). - Gauge (receives
float64as the argument to methodConsiderValue).
ConsiderValue is analog of prometheus' Observe
So there're available next aggregative metrics:
- TimingFlow
- TimingBuffered
- TimingSimple
- GaugeFlow
- GaugeBuffered
- GaugeSimple
An aggregative metric has aggregative/summarized statistics for a few periods at the same time:
Last-- is the very last value ever received viaConsiderValue.Current-- is the statistics for the current second (which is not complete, yet)1S-- is the statistics for the previous second5S-- is the statistics for the previous 5 seconds1M-- is the statistics for the previous minute- ...
6H-- is the statistics for the last 6 hours1D-- is the statistics for the last dayTotal-- is the total statistics
Once per second the Current became 1S and an new empty Current appears instead. And there's a history of the last
5 statistics for 1S which is used to recalculate statistics for 5S. There's in turn a history of the last
12 statistics for 5S which is used to recalculate statistics for 1M. And so on.
This process is called "slicing" (which is done once per second by default).
To change aggregation periods and slicing interval you can use methods SetAggregationPeriods and SetSlicerInterval
accordingly.
A note: So if you have one aggregative metric it will export every value (max, count, ...) for every aggregation period
(Total, Last, Current, 1S, 5S, ...).
If you have no time to read how every aggregation type works then just read "Use case" of every type.
"Simple" just calculates only min, max, avg and count. It's works quite simple and stupid, doesn't require extra CPU and/or RAM.
Any case where it's not required to get percentile values.
"Flow" calculates min, max, avg, count, per1, per10, per50, per90 and per99 ("per" is a shorthand for "percentile"). It doesn't store observed values (only summarized/aggregated ones)
- It's required to get percentile values, but they could be inaccurate.
- There's a lot of values per second.
- There will be a lot of such metrics.
It just increases/decreases the value (let it call "P") to reach required ratio of [values lower than the value "P"] to [values higher than the value "P"].
Let's image ConsiderValue was called. We do not store previous values so we:
- Pick a random number
[0..1). If it's less than the required percentile then we think that this value should be lower than the current value (and vice versa). - Correct the current value if the prediction in the first stage was wrong.
The function (that implements the above algorithm) is called guessPercentileValue (see common_aggregative_flow.go).
There's a constant iterationsRequiredPerSecond to tune accuracy of the algorithm. The more this constant value is the
more accurate is the algorithm, but more values is required (to be passed through ConsiderValue) per second to
approach the real value. It's set to 20, so this kind of aggregative metrics shouldn't be used if the next condition
is not satisfied: VPS >> 20 (VPS means "values per second", >> means "much more than").
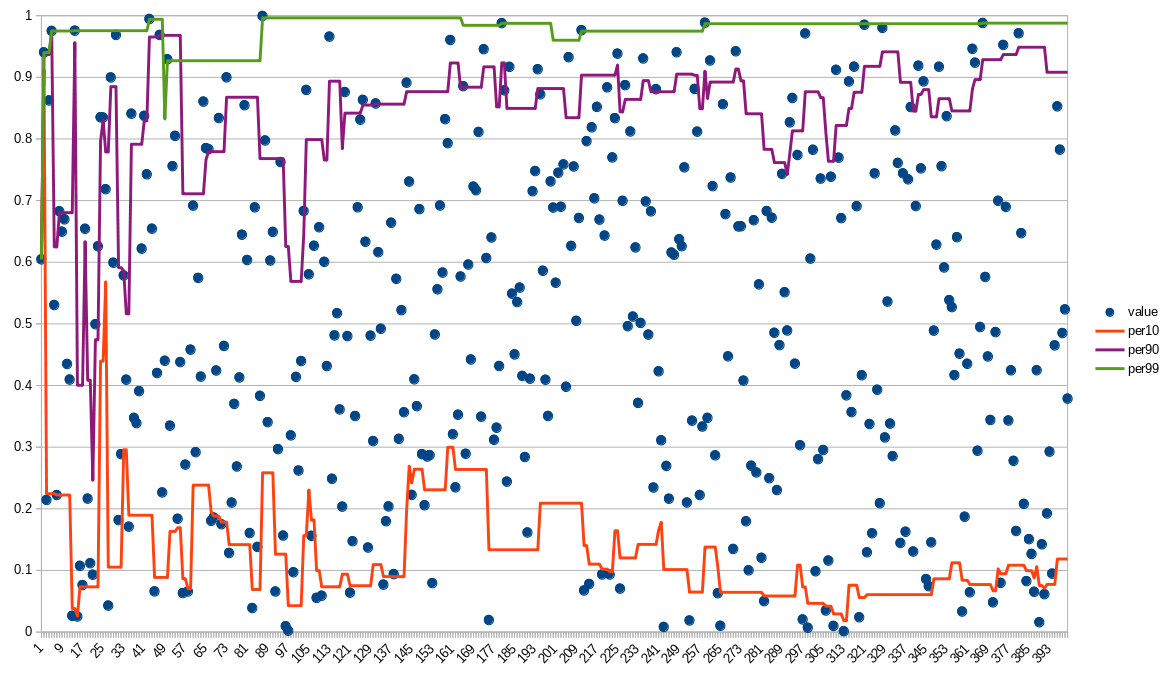 (400 events)
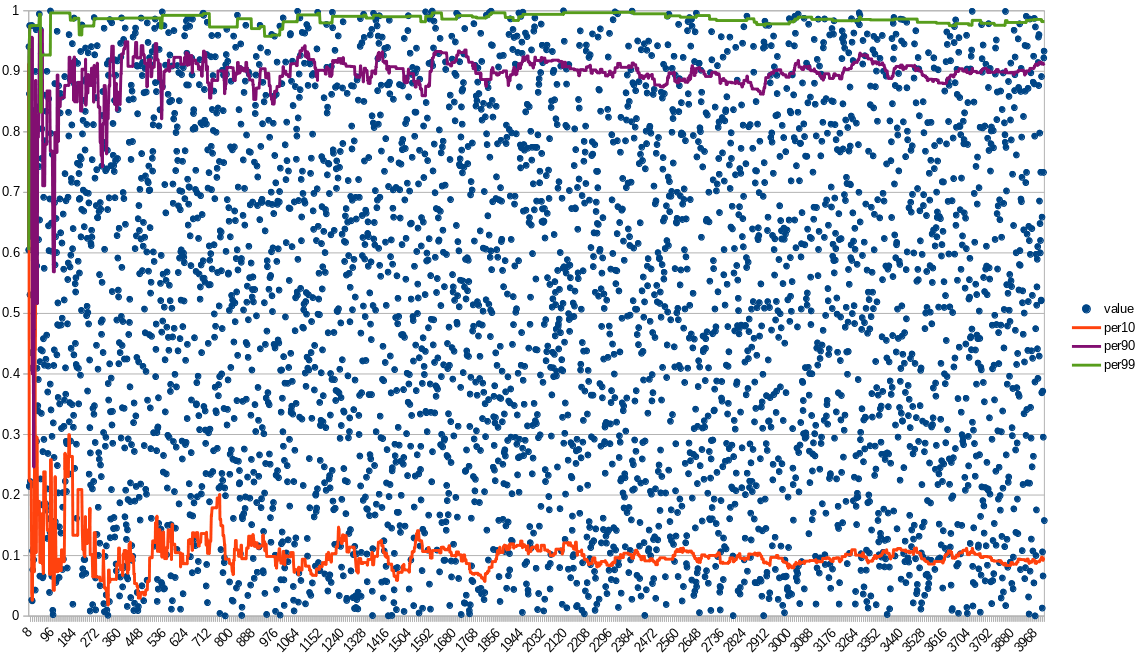 (4000 events)
The more values are passed the more inert is the value and the more accurate it is.
So, again, the "Flow" method should be used only on high VPS.
Attention! There's an unsolved problem of correct merging percentile-related statistics: For example, to calculate percentile statistics for interval "5 seconds" it's required to merge statistics for 5 different seconds (with their-own percentile values), so the resulting percentile value is calculated as just the weighted average of percentile values. It's correct only if the load is monotone. Otherwise it will be inaccurate, but usually good enough.
"Buffered" calculates min, max, avg, count and stores values samples to be able to
calculate any percentile values at any time. This method more precise than the "Flow", but requires much more RAM. The
size of the buffer with the sample values is regulated via method SetAggregativeBufferSize
(the default value is "1000"); the more buffer size is the more accuracy of percentile values is,
but more RAM is required.
Buffered method is much faster than the Flow method:
BenchmarkConsiderValueFlow-8            20000000               120 ns/op               0 B/op          0 allocs/op
BenchmarkConsiderValueBuffered-8        20000000                75.6 ns/op             0 B/op          0 allocs/op
BenchmarkConsiderValueSimple-8          30000000                54.3 ns/op             0 B/op          0 allocs/op
- It's required to get precise percentile values.
- It's required to use really fast metrics.
- There won't be a lot of such metrics (otherwise it will utilize a lot of RAM).
There're two buffer-related specifics:
- The buffer is limited, so how do we handle the rest events (if there're more events per second than the buffer size)?
- How are two buffers get merged to the new one of the same size (see "slicing")?
Both problems are solved using the same initial idea:
Let's imagine we received a 1001-th value (via ConsiderValue), while our buffer
is only 1000 elements long. Then:
- We just skip it with probability 1/1001.
- If it's not skipped then override a random element of the buffer by it.
If we receive a 1002-th event, then we skip it with probability 2/1002... And so on.
It's proven that it's any event value will have an equal probability to get into the buffer. And 1000 elements is enough to calculate value of percentile 99 (there will be 10 element with a higher value).
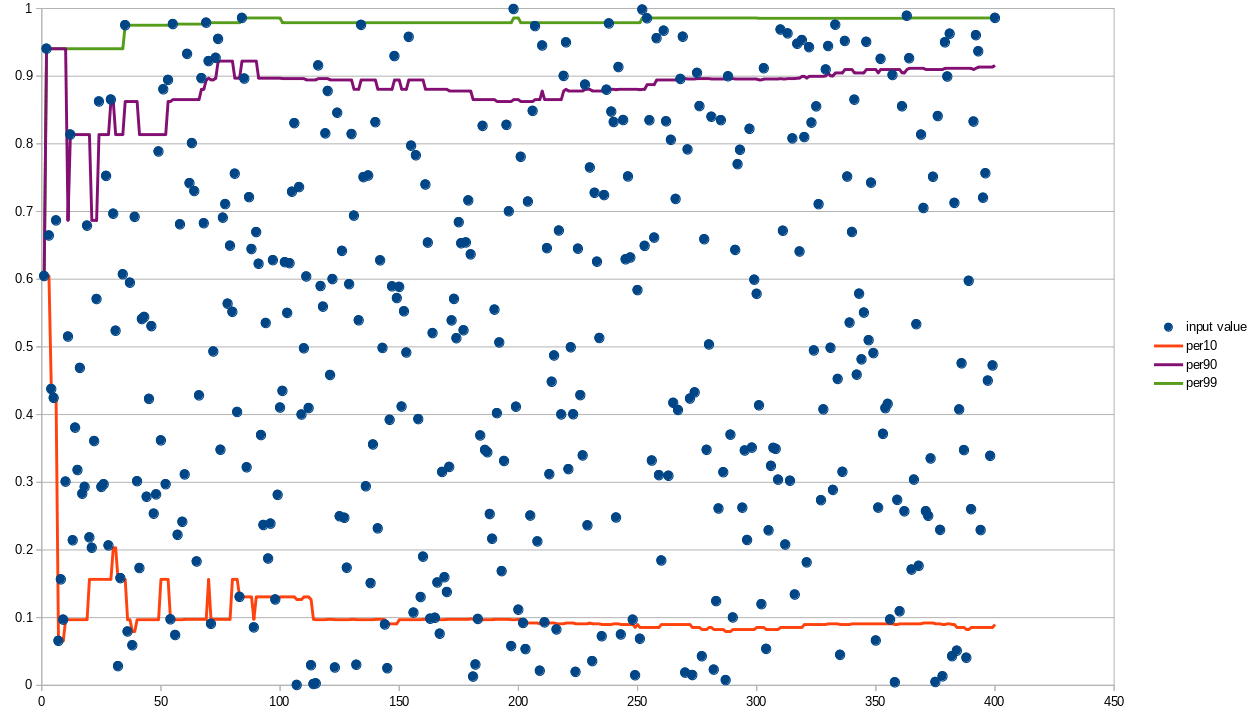 (on this graph the percentile values are absolutely correct, because there's less than 1000 events)
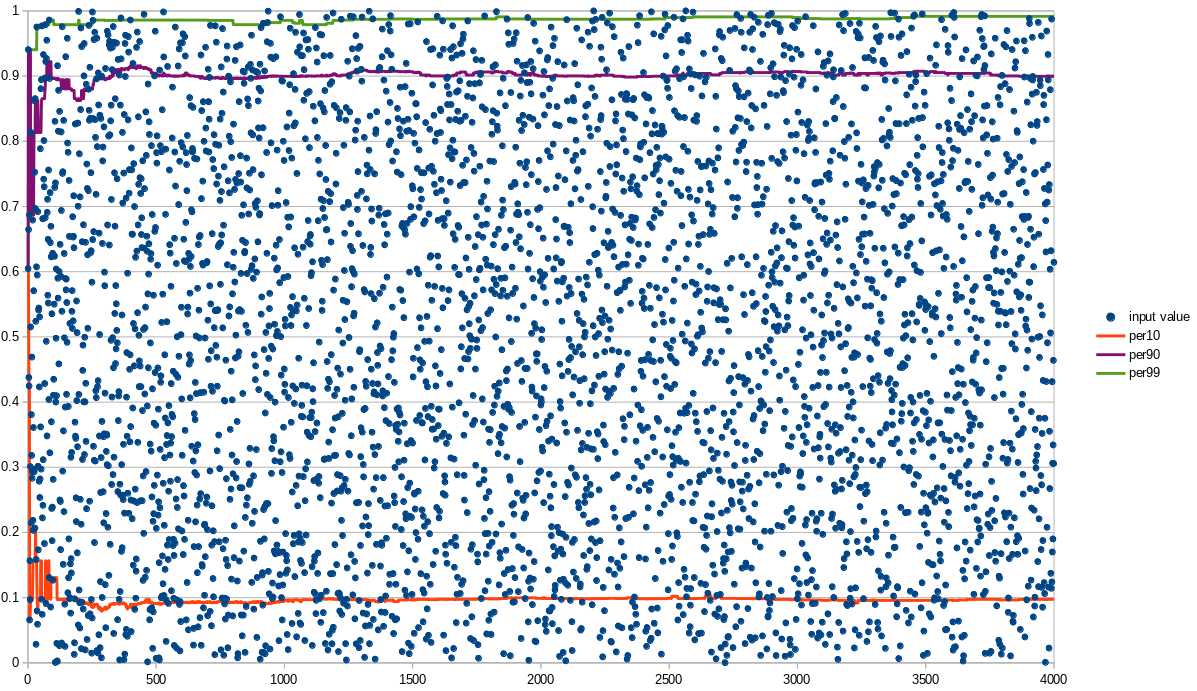 (4000 events)
There're also metrics with the "Func" ending:
- GaugeFloat64Func.
- GaugeInt64Func.
This metrics accepts a function as an argument so they call the function to update their value by themselves.
An example:
server := echo.New()

[...]

engineInstance := fasthttp.WithConfig(engine.Config{
     Address:      srv.Address,
})

metrics.GaugeInt64Func(
    "concurrent_incoming_connections",
    nil,
    func() int64 { return int64(engineInstance.GetOpenConnectionsCount()) },
).SetGCEnabled(false)

server.Run(engineInstance)BenchmarkRegistry-8 20000000 75.1 ns/op 0 B/op 0 allocs/op
BenchmarkRegistryReal-8 5000000 299 ns/op 0 B/op 0 allocs/op
BenchmarkAddToRegistryReal-8 5000000 351 ns/op 0 B/op 0 allocs/op
BenchmarkRegistryRealReal_lazy-8 5000000 390 ns/op 352 B/op 3 allocs/op
BenchmarkRegistryRealReal_normal-8 5000000 317 ns/op 16 B/op 1 allocs/op
BenchmarkRegistryRealReal_FastTags_withHiddenTag-8 5000000 254 ns/op 0 B/op 0 allocs/op
BenchmarkRegistryRealReal_FastTags-8 10000000 233 ns/op 0 B/op 0 allocs/op
For comparison mutex.Lock/mutex.Unlock takes
BenchmarkMutexLockUnlock-8 30000000 57.7 ns/opAlso you can bypass any metric retrieval, for example:
metric := metrics.GaugeInt64(`concurrent_requests`)
metric.SetGCEnabled(false)
http.HandleFunc("/", func (w http.ResponseWriter, r *http.Request) {
	metric.Increment()
	[...]
	metric.Decrement()
})
The incremental and decremental are done in an atomic way and it's safe to use in a concurrent way:
BenchmarkIncrementDecrement-8 100000000 14.0 ns/op 0 B/op 0 allocs/opAlso there's another approach to metrics retrieval -- metric families. It's when a family is retrieved beforehand (like the metric in the example above), but the specific metric is searched through the family using tags. It's a faster retrieval method, but less handy. We do not support such approach, yet; but I hope we will. IIRC, such approach is used in the official prometheus metrics library for Golang.
There're two implementations of tags:
Tags-- just amap[string]interface{}. It's just handy (syntax sugar).FastTags-- faster tags. They prevents unnecessary memory allocations and just works a little faster (usually).
Examples:
// Tags
metrics.Count(`requests`, metrics.Tags{
	`method`: request.Method,
}).Increment()
(see BenchmarkRegistryRealReal_lazy)
// FastTags
tags := metrics.NewFastTags().
	Set(`method`, request.Method)
metrics.Count(`requests`, tags).Increment()
tags.Release()
(see BenchmarkRegistryRealReal_FastTags)
It's also possible to use memory reuse for Tags, too. It reduces memory allocations,
but doesn't eliminate them and takes away the syntax sugar:
tags := metrics.NewTags()
tags[`method`] = request.Method
metrics.Count(`requests`, tags).Increment()
tags.Release()
(see BenchmarkRegistryRealReal_normal)
So for a very high-loaded application I'd recommend to use FastTags, while for the rest
cases you may just use syntax-sugared Tags.
The case without tags at all is the case BenchmarkRegistry (the fastest one):
metrics.Count(`requests`, nil).Increment()In our use cases it appeared we have a lot of short-term metrics (which appears for a few seconds/hours in disappears), so if we keep all the metrics in RAM then our application reaches the RAM limit and dies. Therefore a "garbage collection" (GC) was implemented. The GC just checks which metrics haven't change their values for a long time and removes them.
So every metric has uselessCounter which may reach gcUselessLimit (currently 5). If
the threshold is reached, then the metrics is Stop-ped and the registry's GC will
removed it from the internal storage.
The check if the metric value have changes is done by an Iterator (see "Iterators"). Default interval is 1 minute (so the metrics should be "useless" for at least 5 minutes to be removed).
To disable the GC for a metric you can call bethod SetGCEnabled(false)
An example:
metric := metrics.GaugeInt64(`concurrent_requests`, nil)
metric.SetGCEnabled(false)

[...]
metric.Increase()
[...]
metric.Decrease()
[...]To deduplicate code it's used an approach similar to C++'s inheritance, but using Golang's composition. Here's the scheme:
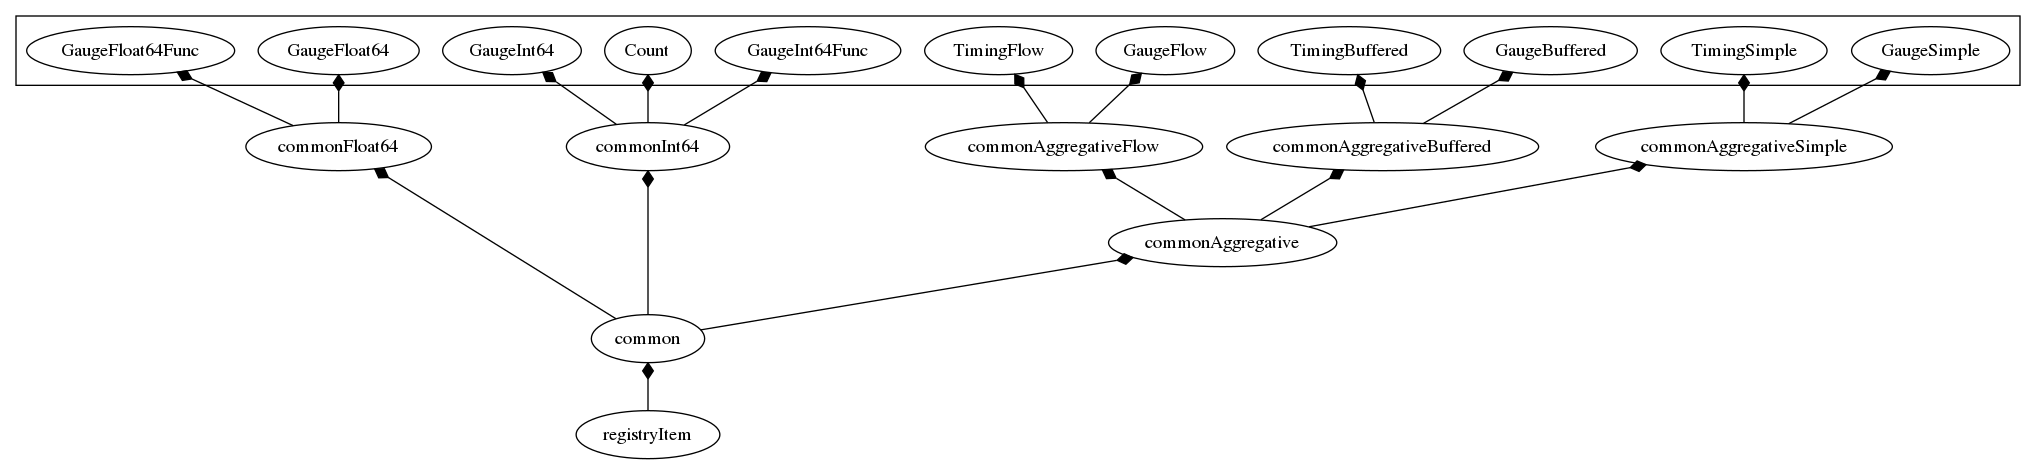
registryItemmakes possible to register the metric into the registrycommonhandles the common (for all metric types) routines like GC orSender.commonAggregativehandles the common routines for all aggregative metrics (like statistics slicing, see "slicing")
There're 3 different background routines for every metric:
- GC (recheck if the metric wasn't changed long time ago and could be removed)
- Sender (see "Sender")
- Slicer (see "Slicing")
If I just run a separate goroutine for every routine and metric then the goroutines start to consumer a lot of CPU, so to deduplicate goroutines there were implemented "iterators".
An iterator just runs every callback function from a slice with specified time interval.
Note: I was too lazy (and there actually was no need) to separate GC and Sender, so it's the same routine.
GoDoc doesn't show public methods of some embedded private structures, sorry for that :(
May be related to https://github.com/golang/go/issues/6127 or may be I did something wrong.