Can zoom out but cannot zoom in again, also weird volume scaling #59
Comments
|
That's interesting. First thought: maybe the timeframe was detected incorrectly. https://github.com/C451/trading-vue-js/blob/master/src/stuff/utils.js#L96 |
|
You are right, this is the output of So I changed the implementation into detect_interval(ohlcv) {
let min = 0
if (ohlcv.length > 1) {
for (let i = 1, n = ohlcv.length; i < n; ++i) {
const gap = ohlcv[i][0] - ohlcv[i-1][0]
if (!min || gap < min) {
min = gap
}
}
}
return min
},But although now it returns |
|
I remember "zoom out" issue, it caused by the minimum candle requirement somewhere. |
|
Since it only depends on the time data, can't it be cached? |
|
The question is : "When to uncache?". Because the data update will trigger So, I'd prefer to use Occam's razor here. If you can suggest more elegant solution, let's discuss. https://github.com/C451/trading-vue-js/blob/master/src/components/Chart.vue#L263 |
|
It isn't Occam razor though because the output of the two functions is different, that is on the border case I described in this issue. As for when to update the cache value, can't it store a reference to the ohlcv data and later compare it by identity. If it is the same then it means any change is streaming data and the interval should be the same and doesn't need to be recomputed. If it is different then it means that the data is fresh. |
|
Maybe not a canonical razor, but In terms of multiplying lines of code, most certainly it is :) Yes, it's possible to identify the change. I'm thinking about |
|
Programming is a trade-off. Since I don't use streaming data my
Since A dead-simple approach is probably to cache the value in the array itself. Maybe something like this. I haven't tried it though since I don't use streaming data. detect_interval(ohlcv) {
let min = 0;
// calculate minimum interval or update cached value with streaming data
if (ohlcv.length > 1) {
let firstIndex = 1;
// retrieve cached value
if (ohlcv.__interval) {
min = ohlcv.__interval;
firstIndex = ohlcv.__lastIndex;
}
let i = firstIndex;
for (let n = ohlcv.length; i < n; ++i) {
const gap = ohlcv[i][0] - ohlcv[i-1][0];
if (!min || gap < min) {
min = gap;
}
}
ohlcv.__interval = min;
ohlcv.__lastIndex = i;
}
return min;
}, |
Yep. Like pretty much everything in life. I'm glad you found a solution for now. Actually, there is no need to store the value. There is a solution with additional 3 or so lines of code, will implement soon. |
|
https://github.com/C451/trading-vue-js/blob/master/src/stuff/utils.js#L104 The reason why I love js. |
|
Cool! Based on Performance-Analysis-JS, it seems that for loop is faster though. I think if you are concerned with performance, it is sufficient to process only the first 100 points of data. The minimum time gap should be detectable in at least 100 points of data, probably less. Unless it is a tick data. As for me, for my usage, I have found a better algorithm, which is detect_interval(ohlcv) {
return 86400000
}, |
Nice idea!
I don't have this luxury, developing the lib for everyone :) You seem to be good at finding simple solutions, maybe you can help to crack the "dynamic grid" prob? The question is how to make a good-looking x-grid with variable step: https://github.com/C451/trading-vue-js/blob/master/src/components/js/grid_maker.js#L158 More specifically, yes, we can put grid lines wherever is necessary, but in some cases the gap will be too small and we'll need to recalc the entire grid to make it look decent. IDK how tradingview.com handles this, but I guess it can be done in linear time. This is the only unresolved problem at the moment. When it resolves, stock charts will finally shine (support gaps via -- https://github.com/C451/trading-vue-js/blob/master/src/components/js/layout_fn.js When time is distorted by gaps, the functions will become more complex and there will be a performance hit. All overlays use these function heavily, so this is a concern. |
|
Well, their lightweight-charts implementation is open source, so you can look at how they compute the ticks. It seems complex. Personally I don't use grid and just like this guy, I found there is no logic to their grid widths 😕. Sorry for the lack of help. |
|
Yeah, had the same though. For me, It's more about the gaps rather than widths. But yeah, ok. |
|
About the gap I think you can just pick a point when the gap between the current point and the previous tick is larger than Before: After let lastTime = undefined
for (var i = 0; i < sub.length; i++) {
let p = sub[i]
if (p[0] % self.t_step === 0 || (lastTime && (p[0] - lastTime) > self.t_step)) {
let x = Math.floor((p[0] - range[0]) * r)
self.xs.push([x, p])
lastTime = p[0]
}
} |

|
That's good for aesthetics, but I'm talking about scrolling through 5m stock chart. Try it, It's a nightmare :) |
|
Sorry, I have only tried daily data. If by gap you mean like the holiday gap, then probably the only practical solution is to change the x scaling into indexed where the x position is determined by the index of the time value in the array instead of the time itself. |
|
Change
|
|
Hi,C451 https://www.echartsjs.com/en/option.html#xAxis In order to avoid gap in 'None Continuous time series data', we use 'category' for the xAxis.type |
|
@msincenselee Thanks, will look into. |
|
I think this is the same problem. For cypto seems to work perfect, because there is 24/24 data, but for stocks seems to broke. I'll try to take a look to see if I can help with the development of this fix. |

|
@RusEu yeah, that would be supa cool. Although there is no easy solution because of this:
|
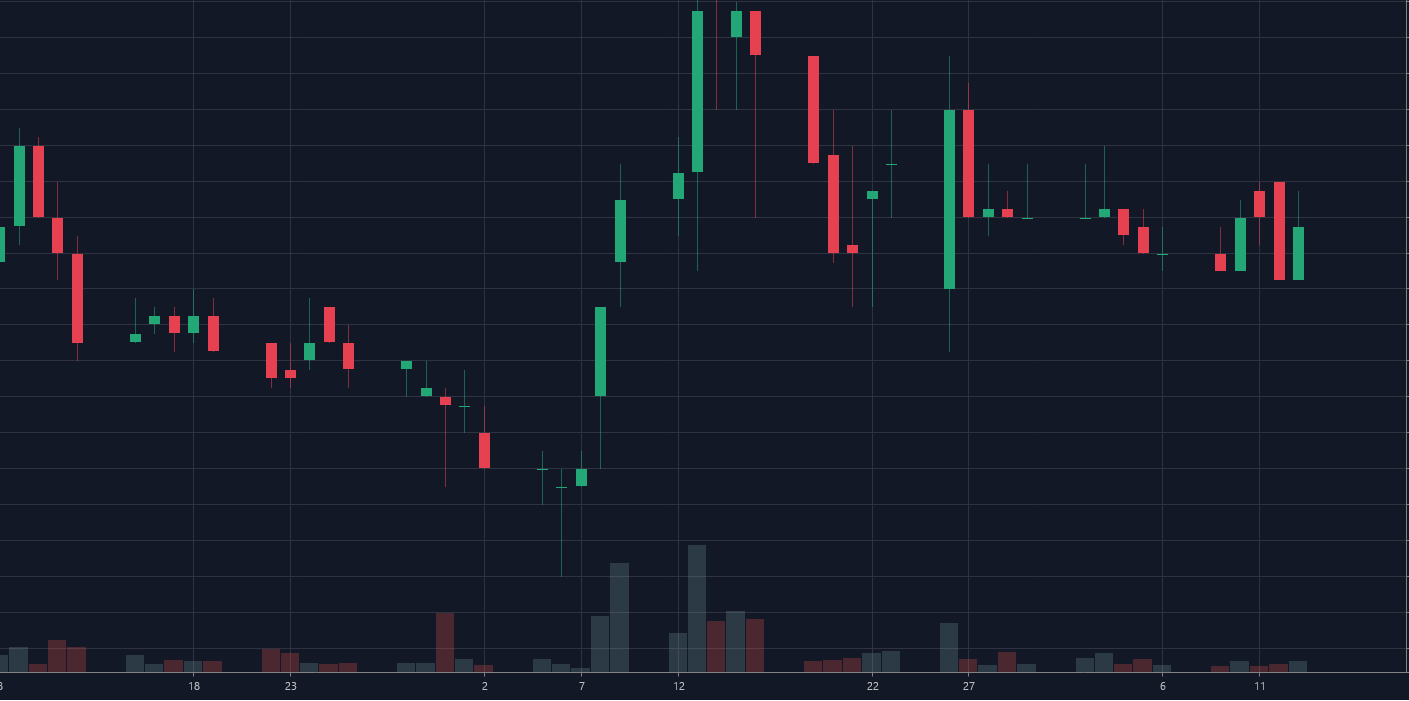
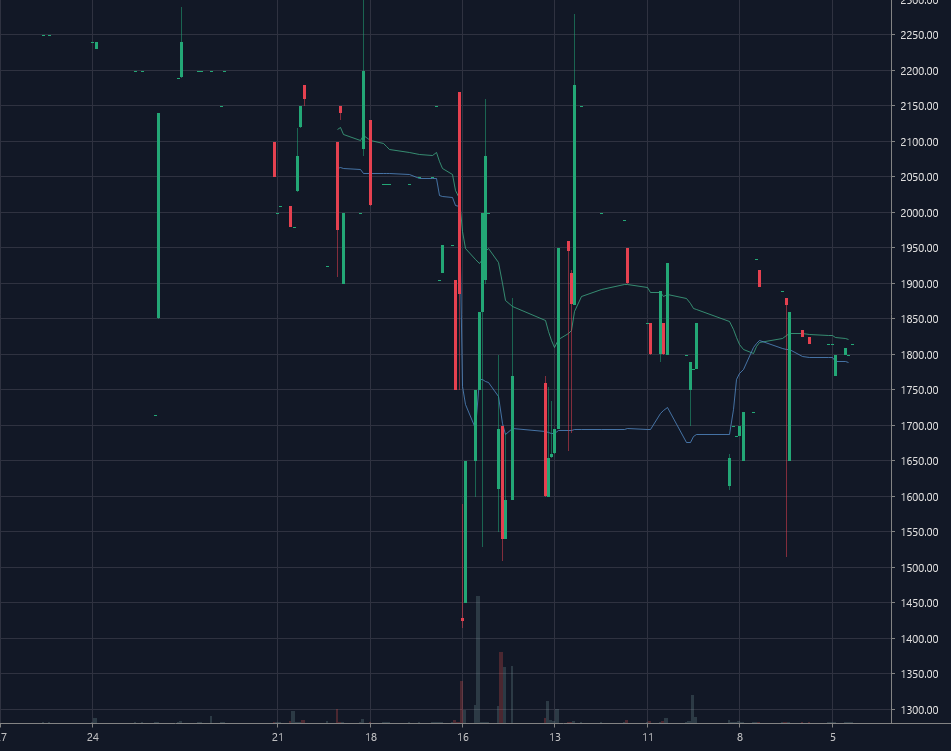
Hi,
I found this particular case with a stock data. Other stock data is working fine.
The weird case: no x axis labels, wrong zooming (compare with the chart below with the same zoom level, and also not uniform volume bar widths), can be zoomed in but cannot be zoomed out. I don't see any error message in the dev console.

The normal case
Dataset
ABDA.zip
The text was updated successfully, but these errors were encountered: