 Image: Future Real Estate Investments. Source: Svilen Mielv , FreeImages.com
- Introduction
- Project Summary
- Repo Contents
- Prerequisites
- Feature and Definitions
- Results
- Future Work
- Built With, Contributors, Authors, Acknowledgments
For my Flatiron Module 4 project, I will be forecasting real estate prices of various zip codes using data from Zillow. I will be acting as a consultant for a fictional real-estate investment firm and need to build a time series model to justify my findings. The firm has asked me to determine:
What zip codes in New England’s villages will bring the best five year future return?
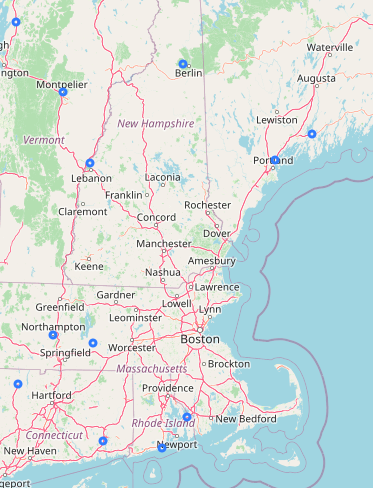
The top twelve zip codes that I were assessed according to my business plan on a folium map. I had to merge the dataset with a secondary source which included latitude and longitude in order to plot these.
For investers looking to buy a property in a quaint New England village, where there town sizes are not too small, nor are the towns considered a suburb or major sprawling city, I have narrowed the field of possibilities and created a model that can forecast with limited certainly the region that is likely to show growth.
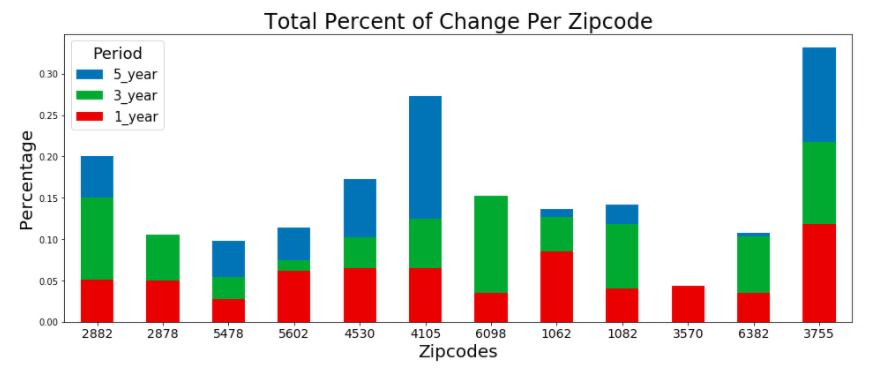 These are the top twelve zip codes, two from each New England state, that were used after filtering the dataset according to the business plan. Graph represents the past three periods examined.
Using my predicted results from my SARIMAX Time Series model and calculated RMSE scores I would recommend the Rhode Island zip code of 02882 as the region with best possibility for investment growth over the next five years. While there certainly are other zip codes around the country and even in New England that may have better growth, only towns with a population of around 10,000 were considered.
This repo contains the following:
- README.md - this is where you are now!
- CONTRIBUTING.md - a reference to the people who made this project possible.
- LICENSE.md - the required license information.
- Final_Notebook.ipynb - the Jupyter Notebook containing the finalized code for this project.
- zillow_data.csv - the file containing the dataset which comes from Zillow (https://www.zillow.com/research/data/)
- zip_code_database.csv - file containing zip code lat/lon (https://www.unitedstateszipcodes.org/zip-code-database/)
- population_by_zip_2010.csv - https://www.kaggle.com/census/us-population-by-zip-code#population_by_zip_2010.csv
- new_england.gif - a free map of New England to help me look at the geography.
- Notebook_Folder - a folder of extra notebooks, documents, and code that helped me along the way.
- mod_4_project_blog_link - the link to my Medium blog post pertaining to this project.
- mod_4_project_slideshow_pdf - a pdf of my non-technical presentation
- mod_4_project_video_link - a video of my non-technical presentation (https://drive.google.com/open?id=1_t8QUgXUJytytlwLOJjOUlGwfJjvTPR9)
- mod_4_project_slideshow_link - the actual link to my non-technical presentation (https://docs.google.com/presentation/d/1h0DkuZIOwfLfhYPTDLhRe9GqbTyQu_UW1I-Rqo0PAPk/edit?usp=sharing)
These are the libraries that I used in this project.
- numpy as np
- pandas as pd
- matplotlib.pyplot as plt
- %matplotlib inline
- from statsmodels.graphics.tsaplots import plot_acf, plot_pacf
- import itertools
- from matplotlib.pylab import rcParams
- from statsmodels.tsa.arima_model import ARMA
- import statsmodels.api as sm
- np.random.seed(123)
- import folium (for visual)
The three datasets below I used each had there own individual nuances that needed to be dealt with during cleaning.
*RegionID = some irrelevant code *RegionName = Zipcode *City *State *Metro = larger metro area *CountyName *SizeRank = another irrelevant code
This dataset had lots of informatio but all I was really interested in was the zip code and lat and long. zip *type *decommissioned *primary_city *acceptable_cities *unacceptable_cities *state *county *timezone *area_codes *world_region *country latitude longitude *irs_estimated_population_2015
This dataset was confusing in the way the population was organized. The population was counted for each of the three categories (minimum_age, maximum_age, gender) but integrated into the totals which were filtered out by NaN's. population *minimum_age *maximum_age *gender zipcode *geo_id
According to the business plan and time series model, the small, coastal zip code of 02882 in Rhode Island had the highest possible five year growth in relation to it's current housing market.
Below is a Partial Autocorrelation graph for the final RH zip code. This graph was used in addition to the Autocorrelation graph to help determine the parameters for the time series model.
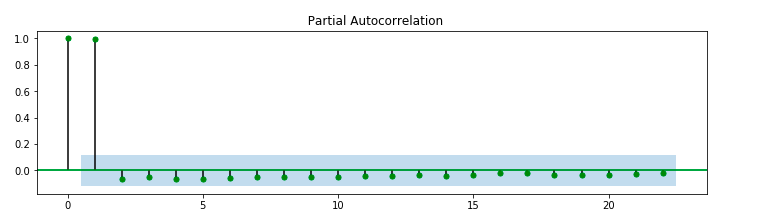
After having checked all the correlograms to make sure that the p-d-q values looked good I went ahead and ran the SARIMAX models (once for each of the six final zip codes) and used the lowest AIC scores to determine the best fit. I then coded the RMSE values to help me analyze the results of the forecast.
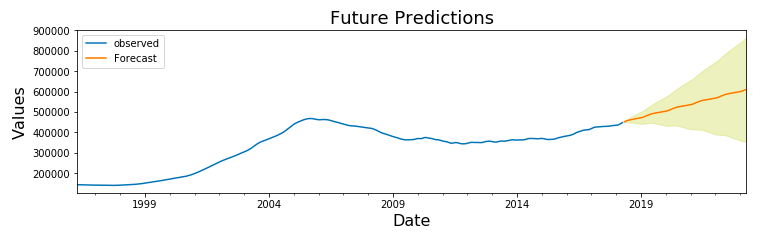 Home price averages for RH zip code 02882 for all the data. The five year future prediction is shaded in yellow, which includes possible high and low for the forcast.
The Rhode Island zip code of 02882 showed the best change in value for the mean of predictions at 34.93% even though it had one of the larger RMSE scores of 1189.54. Yet considering the price of houses for this region were nearly double that of some of the other regions it means that this prediction is still the best.
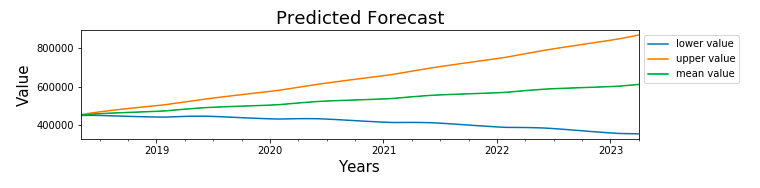 The five year future predictions for just the Rhode Island zip code 02882.
Conneticut's zip code of 06382 had the best RMSE of 492.69 but also had one of the cheapest housing prices - along with only an 11.11% predicted change in value it seems like not the top choice. It's interesting to note that this zip code is near the ocean but doesn't actually have any ocean-front properties.
New Hampshire had the worst predicted value and the only forecasted score that was negative of -2.26%. Along with the worst RMSE score of the group of 1682.61 though it should also be noted that this zip code of 03755 had the most expensive housing market and is probably one of the hardest places to actually currently buy.
The second highest predicted value came from Maine zip code 04105 with a predicted change of 23.88%. This was interesting considering the top two zip codes were along the ocean coast. Yet again, the RMSE was the second highest of 1496.72 which correlated with having the second highest current house price.
 Image: Future housing price predictions using a SARIMAX Time Series Model. Source: Morning Brew, Upsplash
I would like to apply my model to other rural towns or the large cities in New England. I would like to include specific zip code demographics or perhaps population density.
More importantly, I would like to use towns or village names instead of zip code to build my model. In doing research of various regions I discovered that zip code lines tend to be drawn differently than how neighborhoods develop or how real estate values seem to be considered. It is quite possible to find two very different houses in the same zip code with varying degree of price and selectability, for zip code location tends to be much more broad than town or county lines. As well, zip code relates to the population density which I believe is an important factor to consider when buying a house, yet only total population numbers were included in my model.
Outside of investment, a regions schools, employment opportunities, and relationship to tourism are huge factors to consider. These factors can greatly effect the housing market.
For future work I would also consider looking at regions outside of New England, though I really like being able to narrow the field down to a relatively small group of interesting zip codes.
Jupyter Notebook MacBook Air - Catalina OS Python 3.0 statsmodels libraries scikit.learn GitHub
Please read CONTRIBUTING.md for details
Thomas Whipple Flatiron Academy
Flatiron Academy - see the LICENSE.md file for details
Thank you to my cohort team for all of their suggestions, Flatiron coaches, and to our instructor Abhineet Kulkarni.