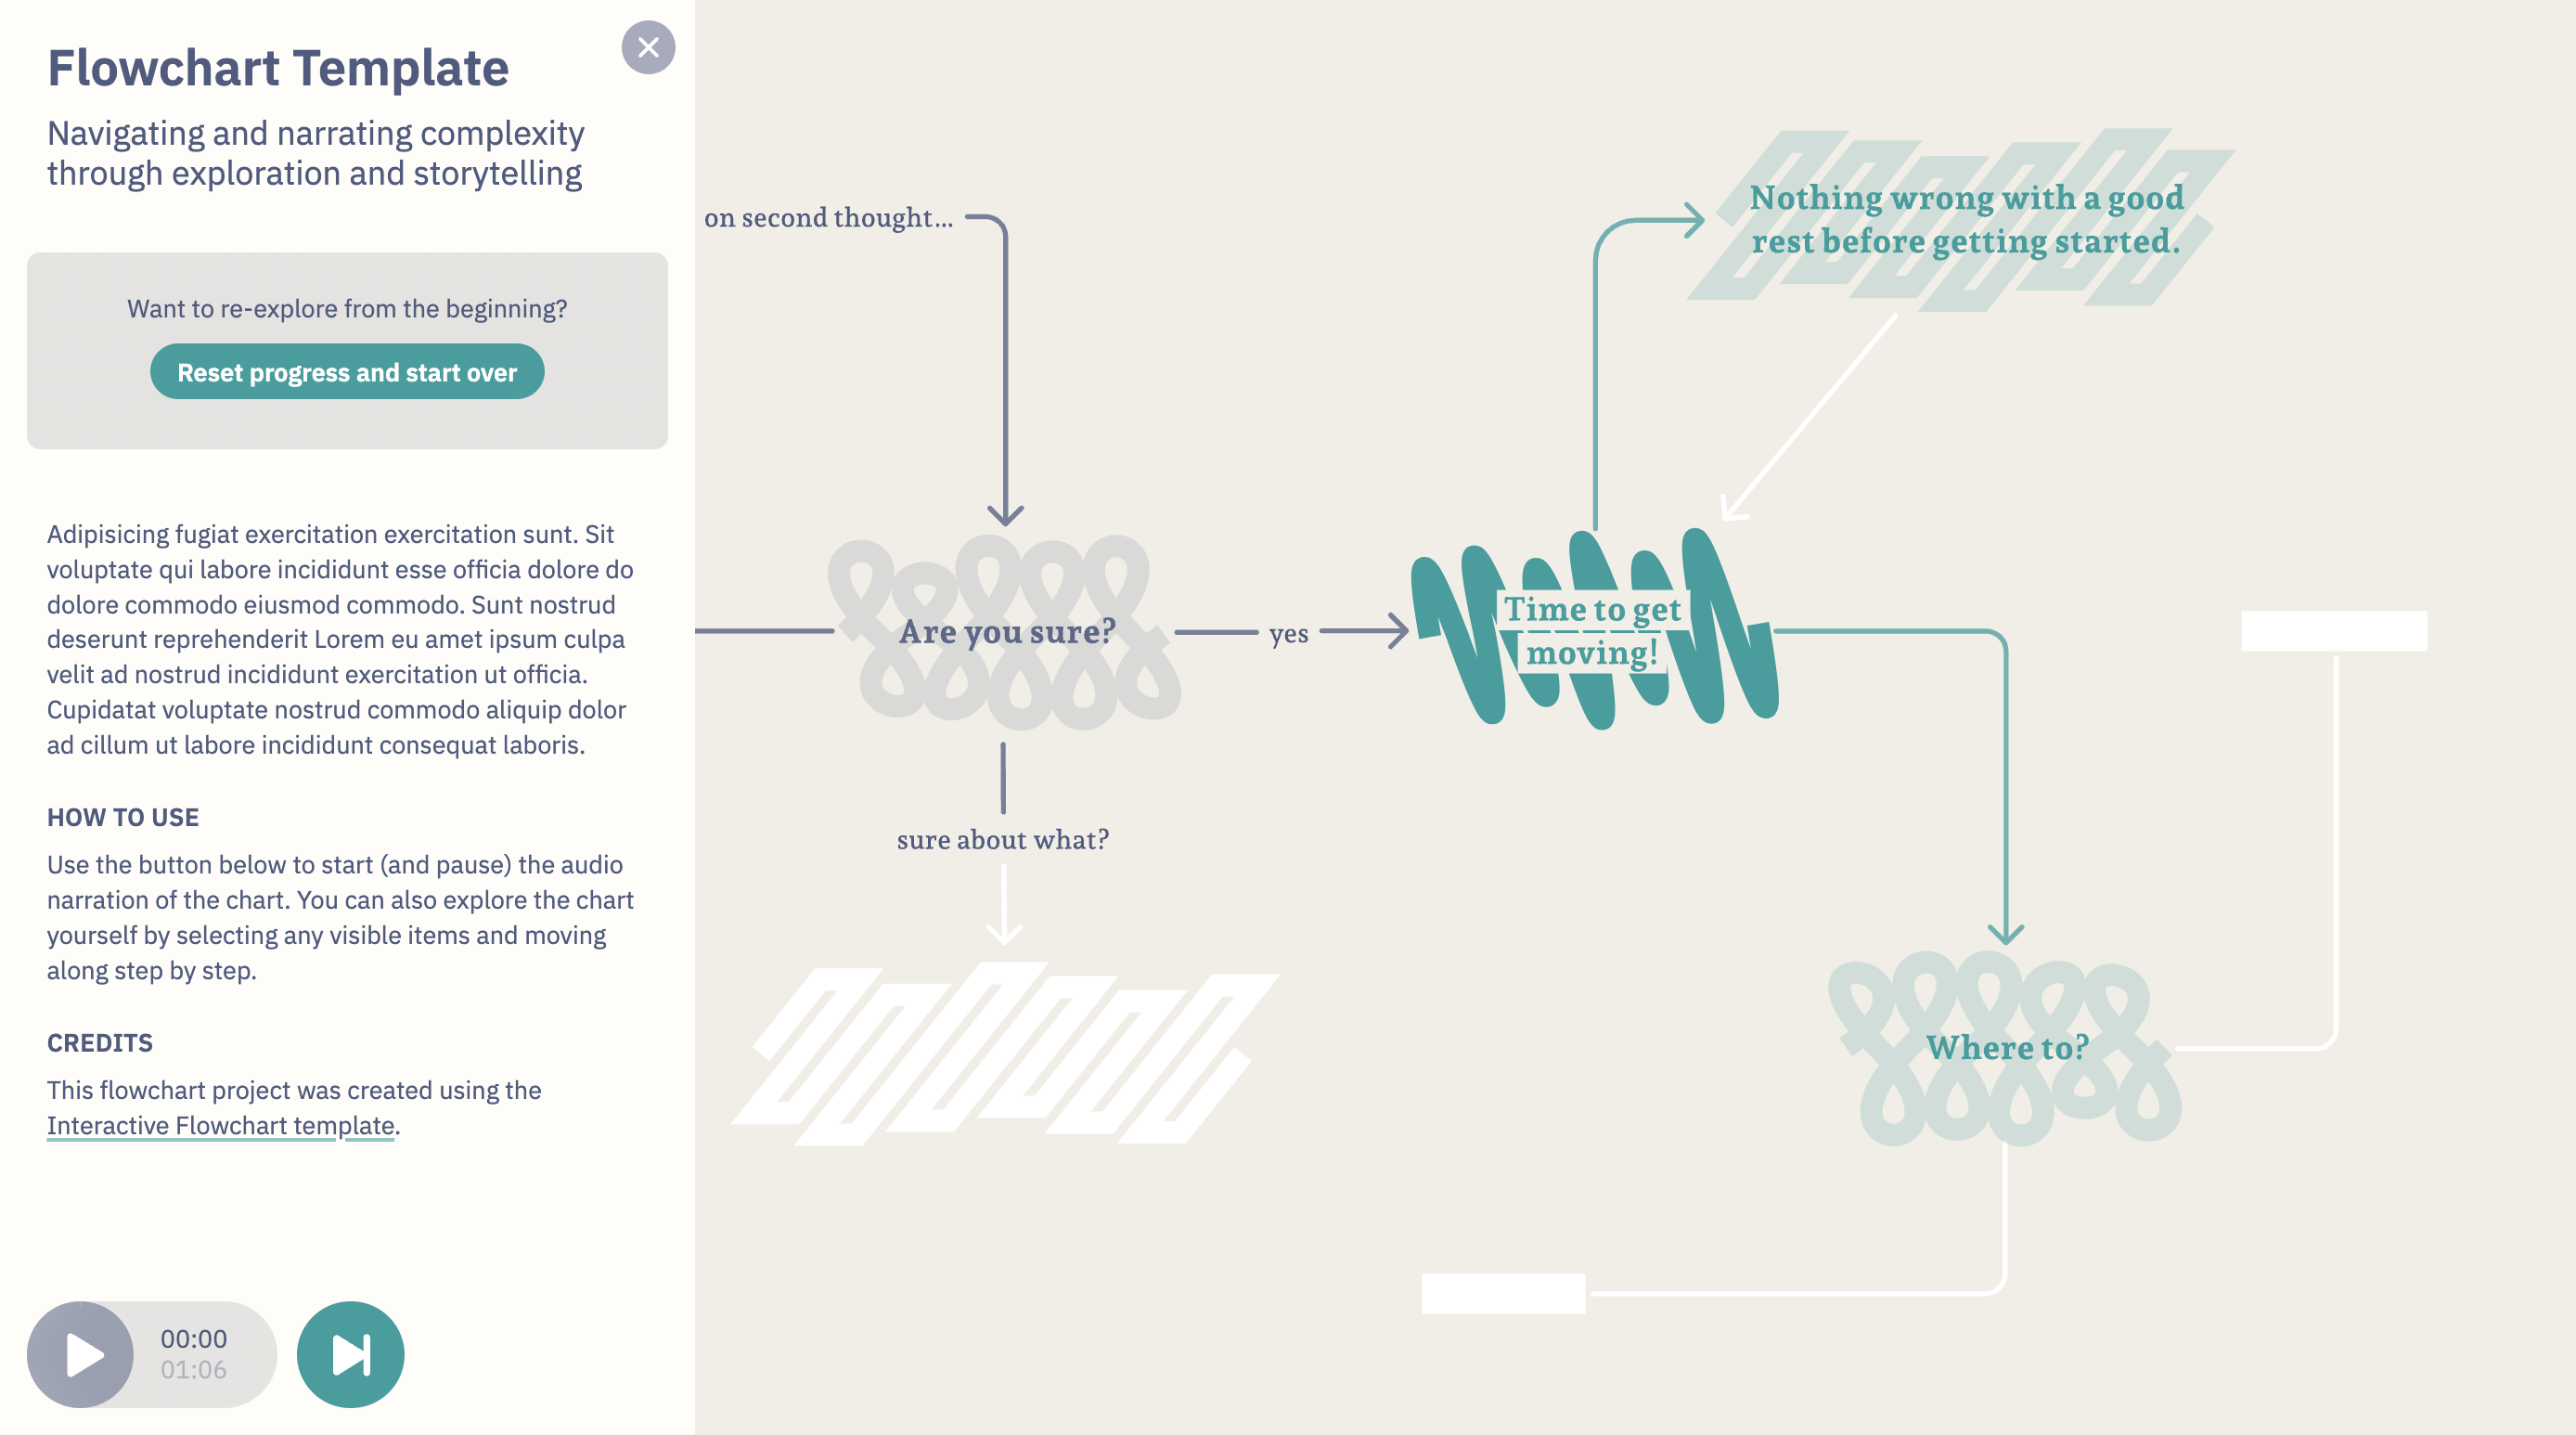
Navigating and narrating complexity through exploration and storytelling
This interface concept of an interactive flowchart proposes the combination of linear audio narration with non-linear open-ended exploration, offering a novel way to understand and navigate complex issues. The interactive flowchart is designed to be inviting and engaging, allowing viewers, readers, and learners to follow a guided tour through a flowchart and pursue their own paths through its contents.
→ https://uclab.fh-potsdam.de/interactive-flowchart/demo/
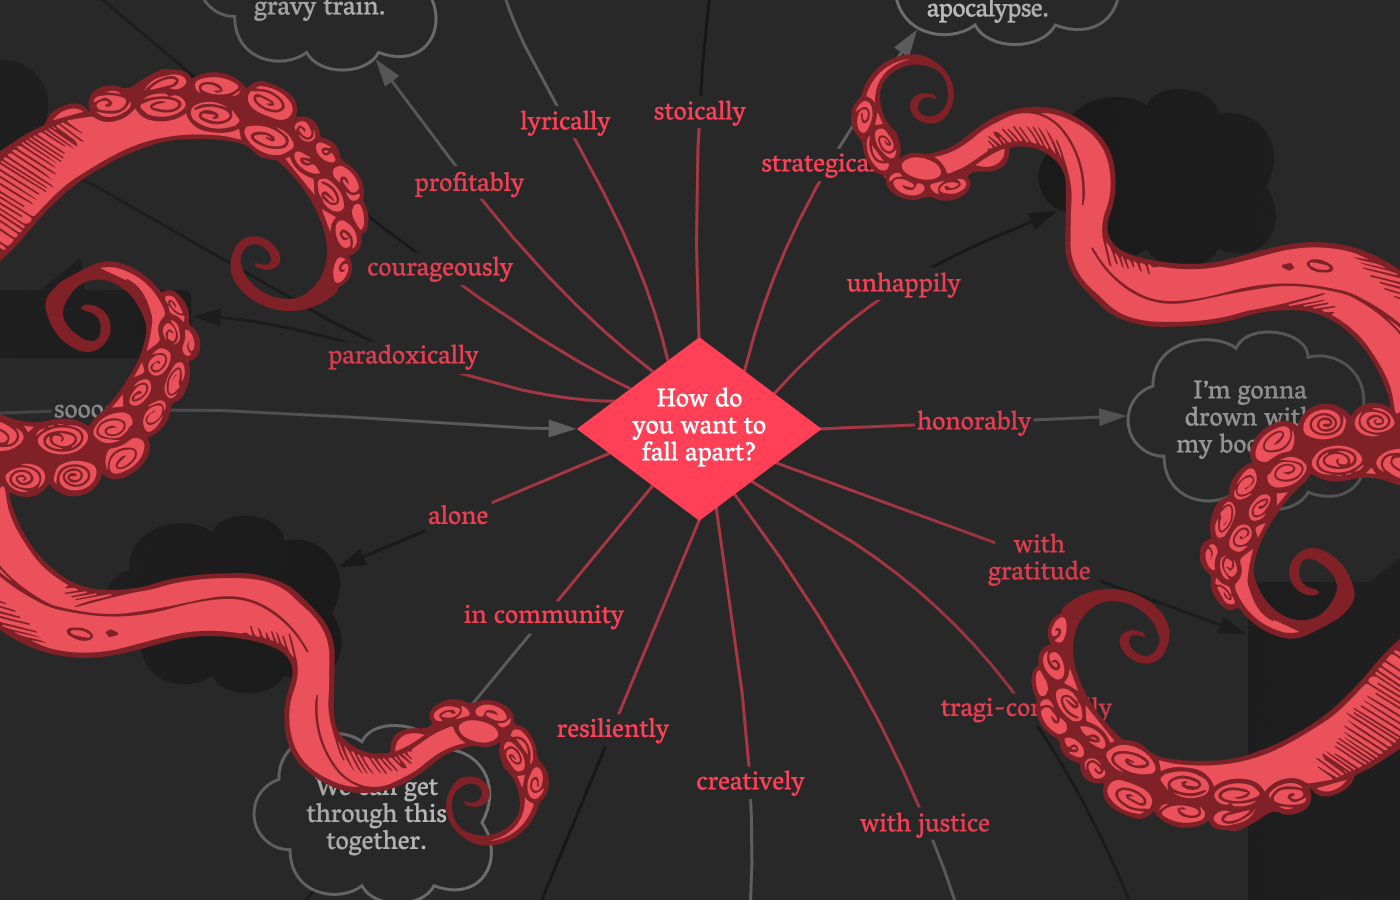
The project is originally inspired by Andrew Boyd’s attempt to come to grips with the climate crisis through a printed flowchart included in his recently published book “I Want a Better Catastrophe”. In addition to an expansive canvas of 330 interconnected nodes, the interactive version contains a nearly one-hour-long audio narration, in which Andrew offers one pathway through the chart and elaborates on many of its topics and elements.
→ https://flowchart.bettercatastrophe.com/
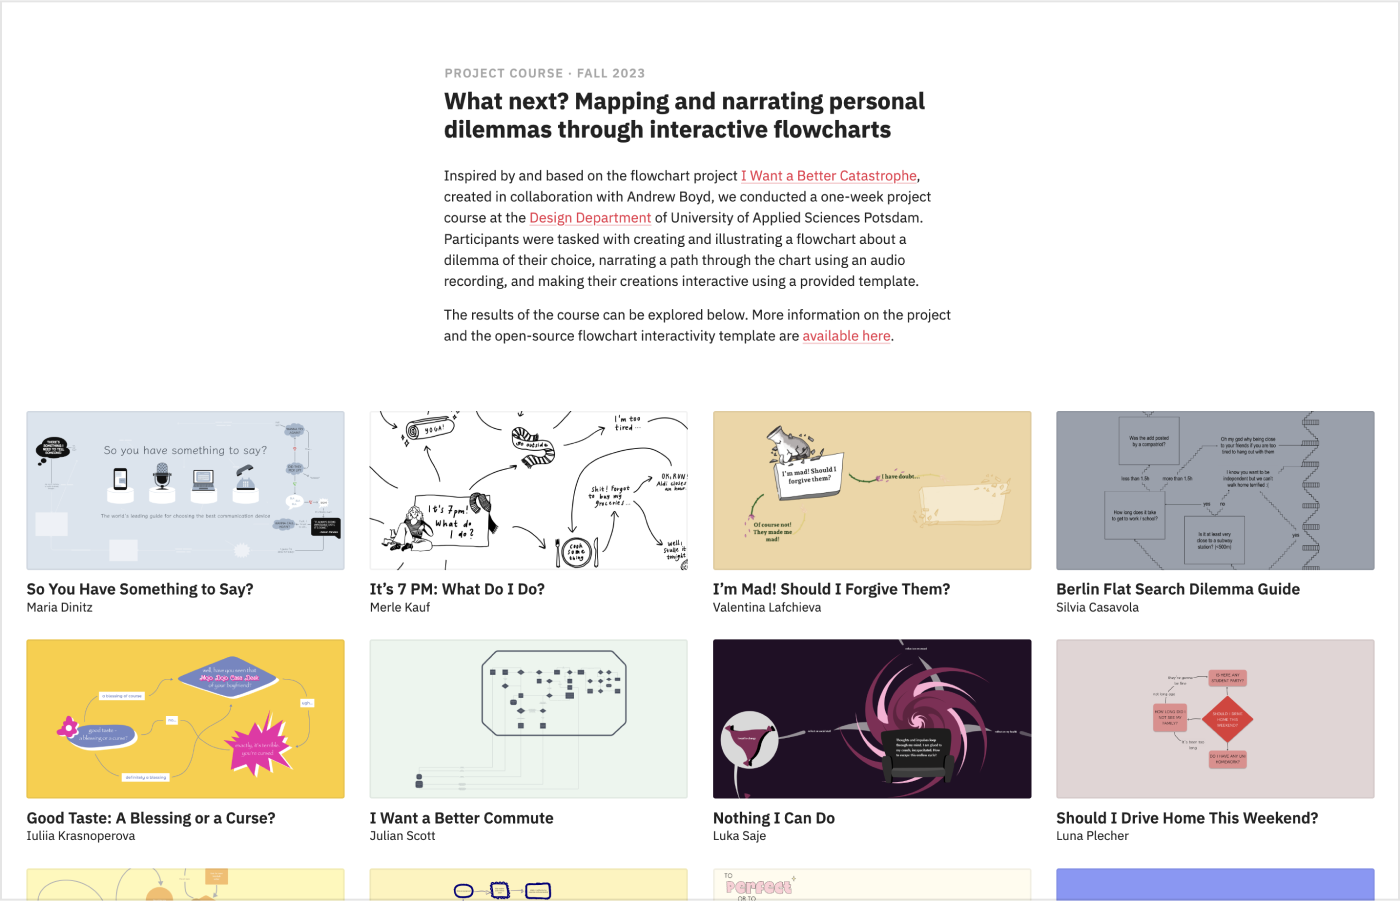
After restructuring the interactive version of the “I Want a Better Catastrophe” flowchart as the customizable template provided here, a one-week project course at the Design Department of University of Applied Sciences Potsdam was conducted. Participants were tasked with creating and illustrating a flowchart about a dilemma of their choice, narrating a path through the chart using an audio recording, and making their creations interactive using the template.
→ https://uclab.fh-potsdam.de/interactive-flowchart/projects/
The template’s customizable contents are split across five files, all of which are stored in the public directory. Therefore, the template can be adapted by downloading a pre-built release and exchanging these files, without the need for a build step. (Nonetheless, the project’s source can be set up using npm install, tested using npm run dev and built using npm run build.)
In order to run, the template’s files need to be served/accessed through a web server. For local testing purposes, a local server environment like macOS’s built-in Apache server or the Live Server Visual Studio Code extension can be used.
In addition to the details outlined below, the process of customizing the template is also available as a visual tutorial:
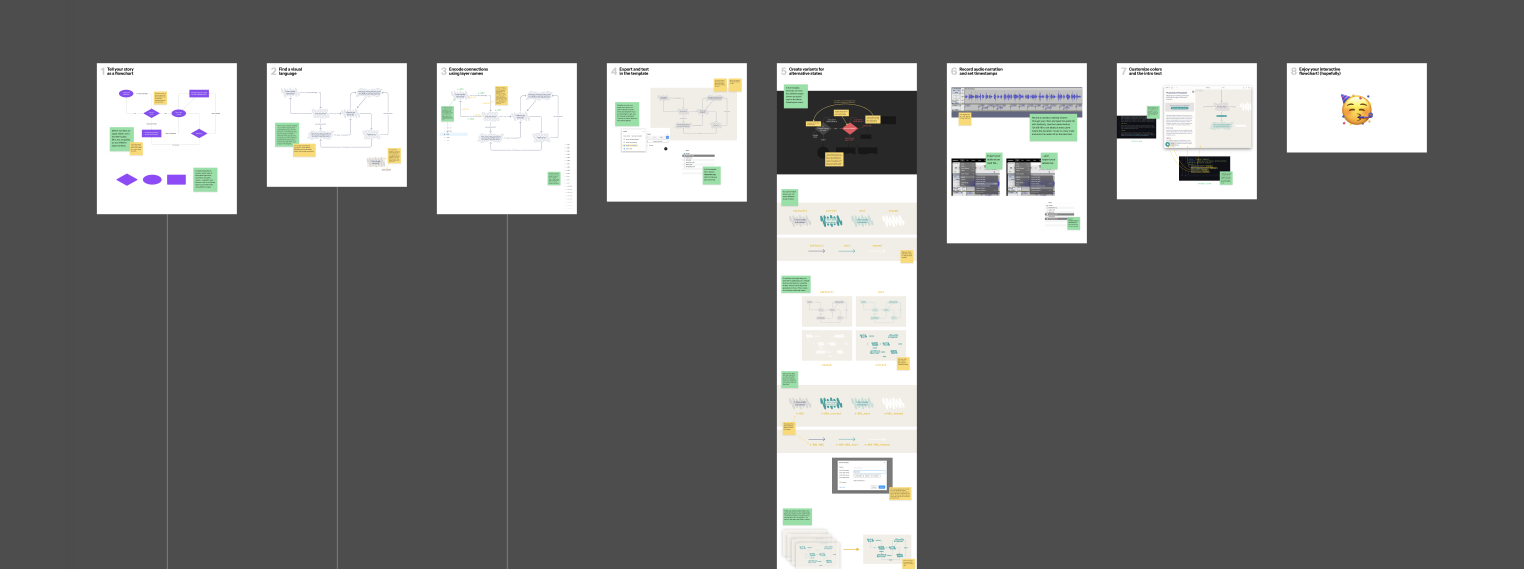
→ https://figma.com/file/oEk2RN9Ebt9KQkU8KIrR3a/
The flowchart displayed in the template is loaded from flowchart.svg. Nodes, edges and the relationships between them are encoded by setting the id attribute on groups or elements within the SVG file’s structure. (With the right export settings, layer/group names within Figma or Illustrator can be output as the id attribute, making this process easier.)
Each node needs to be assigned a unique ID with n- prepended, such as n-001, n-002, and so on. In a subsequent step, edges then need to be named according to their origin and destination nodes’ IDs, such as e-001-002 if the edge emerges from n-001 and points to n-002.
To enrich the interactive experience of “uncovering” the chart, nodes and edges can have different visual states, depending on the viewer’s position in relation to them. In addition to the default appearance (if a node has previously been discovered), these states are current (if a node is currently selected), next (if a node/edge immediately succeeds the currently selected node), and teased (if a node/edge is two steps ahead of the currently selected node, acting as a “teaser” of what lies further ahead).
To include these alternate states, the layers/groups of nodes and edges can be duplicated and visually customized, after which the name of the respective state needs to be appended to the ID followed by an underscore. Node n-001 can therefore have the alternate states n-001_current, n-001_next and n-001_teased. If such alternate states are found by the template, they are swapped in when the respective conditions are met; otherwise the default elements are used. Therefore, the template can be used with or without any alternate states.
An audio narration can be added as narration.mp3. If no such file is found, the narrative features of the flowchart template are disabled.
The relationship between the audio narration and the flowchart can be established through timestamps.txt. Each line of this file contains a timestamp in seconds and, with a tab character in between (TSV), the ID of the node that becomes active when that timestamp is reached within the narration. If the timestamps are created and exported using Audacity’s Labels feature, the file that is output can be used without any further modification. (The second column, output by Audacity as an “end of timestamp” value, is ignored in this case.)
If timestamps.txt is present, the flowchart reacts to playback of the audio narration and the feature of “jumping” the playback position to a different part of the chart is enabled where applicable.
The following values can be set within setup.json:
id: A unique flowchart ID (relevant if multiple flowcharts are running on the same domain, as the ID is used as a key within localStorage to store the chart’s state for resumption)title: A title, displayed in the intro panelsubtitle: A subtitle, displayed below the title in the intro panelcolors: An array of colors with hex values, which can be changed to customize the overall appearance of the template and its interface elements
The introductory text displayed within the intro panel can be edited in intro.md.
With this project, we introduce an interaction technique for flowcharts that combines progressive disclosure, linear storytelling and open-ended exploration. The project initially started with a flowchart included as a foldout page in the book “I Want A Better Catastrophe: Navigating the Climate Crisis with Grief, Hope, and Gallows Humor” by Andrew Boyd. Our design-oriented research investigates how an interactive version of this chart can make its contents and connections explorable, narratable, and ultimately relatable. The research approach has been iterative, in close collaboration with the author and has drawn upon regular feedback exchanges with other visualization and interface scholars. It is our ambition to revise an established genre of information design and interweave storytelling and interactivity without sacrificing one over the other.
Flowcharts are used in a variety of domains to visually represent complex processes and systems in order to better understand and improve those systems. On one hand, scrollytelling and progressive disclosure can be employed to iteratively present flowcharts with the goal of explaining complex issues in a more gradual manner. On the other hand, interactivity and exploration can be used to enable non-linear, personalized pathways through a flowchart’s web of elements. So far, these author-driven vs. reader-driven approaches of narration and exploration have largely been treated as separate modes, with the combination of an audio narration and an interactive chart being particularly rare.
The interactive flowchart bridges this separation by integrating audio narration and interactive exploration within a unified visual interface, allowing both linear/narrated as well as non-linear/interactive readings of the chart’s connections. The resulting prototype implements strategies of progressively disclosing the chart, supporting the shift between recorded narration and interactive exploration, appropriately representing and conveying the liveliness of the narration as well as adjusting the narration’s playback position based on self-explored locations within the chart. For these purposes, a floating control interface is introduced, which adapts to the currently active mode of reading and allows playing/pausing the audio narration, browsing chapters within the narrative sequence, and advancing the narration to a certain chapter or spatial position within the chart. Undisclosed, discovered, and visited elements within the flowchart and control interface are furthermore differentiated using distinct visual styles.
Interactive Flowchart is developed within UCLAB at University of Applied Sciences Potsdam and has involved:
- Jona Pomerance: Ideation, design and development
- Marian Dörk: Research supervision
- Andrew Boyd: “I Want a Better Catastrophe” (book and original flowchart)