Heatmap
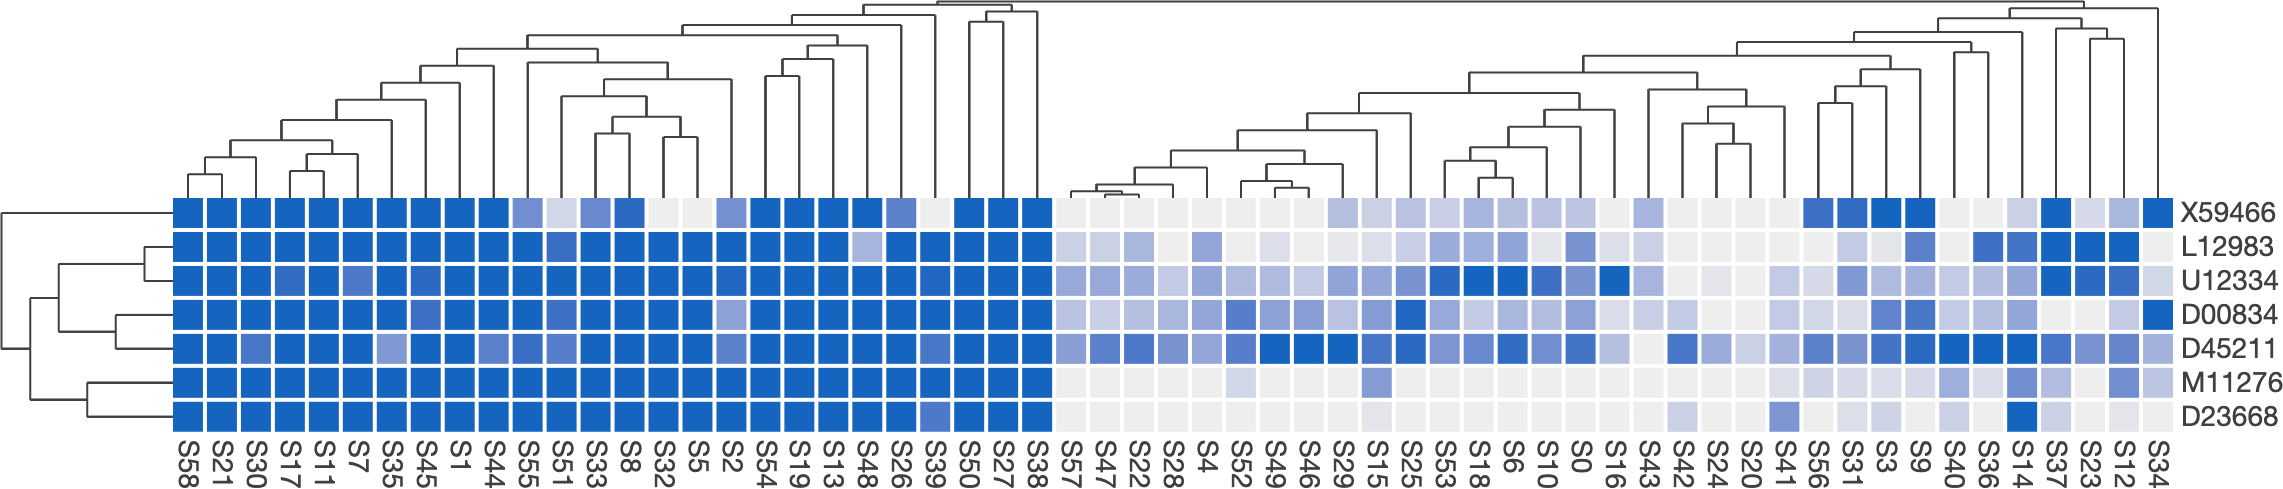
The Heatmap is a visualization that shows magnitude of a phenomenon as color in two dimensions. The brightness of every cell in the heatmap depends on the value of the underlying data point. All rows and columns of the heatmap can be clustered and reordered. This means that rows and columns that are most similar to each other will be placed close to each other. A dendrogram can, optionally, be enabled which shows the different steps in which clusters are merged. For more information on clustering, see this page on Wikipedia about the UPGMA algorithm.
 A live example of this visualization can be found on Observable.
The heatmap has been developed to render large amounts of data as fast as possible. To achieve this goal, it uses a HTML Canvas under the hood (in combination with D3v6). The native refresh speed of most monitors can be achieved with heatmaps consisting of up to 300 * 300 elements.
The heatmap uses the UPGMA algorithm to cluster the different rows and columns and uses the MOLO heuristic to reorder the clustered items.
The MOLO-heuristic is a technique that can be used to reorder a dendrogram. It's main goal is to improve the interpretability of a dendrogram, while still retaining the intrinsic properties of the cluster-subcluster relationships in a dendrogram. This heuristic can be applied both while constructing the dendrogram or afterwards on a pre-existing dendrogram. The inner workings of the heuristic can be best explained during dendrogram construction, which is what we will do here:
The goal of the algorithm is to pairwise merge clusters until only one big cluster (containing all original data points) remains. The following steps need to be repeated until only one cluster remains:
- Compute the pairwise similarity score for all clusters. Assume that
aandbare most similar, then we need to distinguish three different cases:-
aandbare both singleton clusters (clusters containing only one data point). Create a new noded. The orientation ofaandb(and thus the decision of which cluster should become the left child ofd) is determined by the order of observations in the input data. -
ais a singleton cluster andbis not. Create a new noded. Assign the singleton clusteraas the right child ofdandbas the left child. -
aandbare both non-singleton clusters. Create a new noded. Determine which ofaandbis the subtree with the smallest distance among all of preceding merges and assign this cluster as the left child ofd. Note that the subtree with the smallest distance among all preceding merges intuitively corresponds to the subtree with the shortest height in the dendrogram.
-
See this figure for an example of this heuristic:
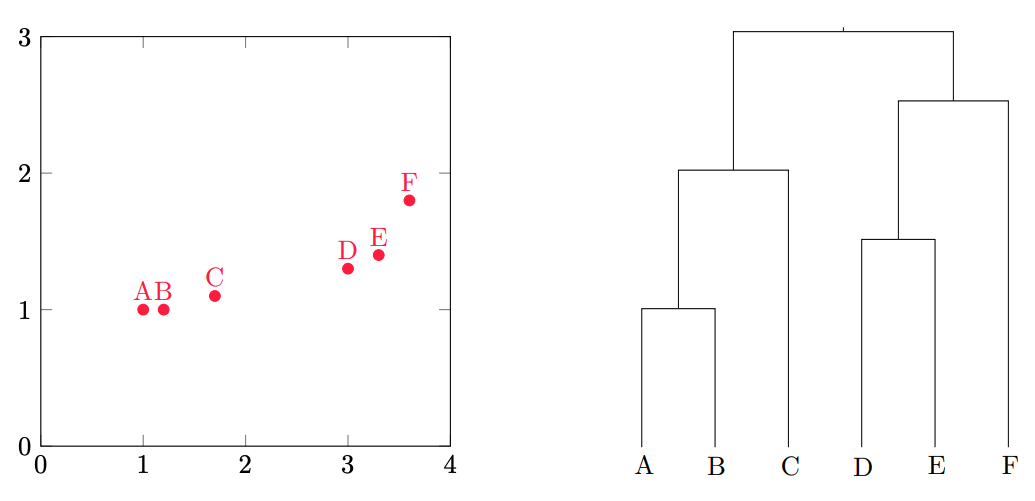
The following steps were performed to come to this result:
-
AandBare situated closest together and will be merged first. SinceA < Bholds, we will setAas the left child of the newly created node. - Singleton clusters
DandEare next and are merged in a similar fashion asAandB. -
A-BandCare now the most similar clusters and need to be merged. SinceCis a singleton cluster andA-Bis not, we will assignCas the left child of the new node. - The same applies for the clusters
D-EandF. - In the final step we need to consider the clusters
A-B-CandD-E-F. SinceA-B-Cwere merged first, this is the subtree with the smallest distance among all preceding merges. This means thatA-B-Cshould be placed as the left child of the final root node, resulting in the dendrogram that can be seen in the figure above.
The constructor of the Heatmap class automatically starts rendering the heatmap upon invocation and has following
signature:
-
elementIdentifier: HTMLElement: TheHTMLElementin which the heatmap should be rendered. -
values: number[][]: A two-dimensional array with all the values that should be visualized. These values will be normalized to the[0, 1]-interval before they are rendered by the heatmap. -
rowLabels: string[]: Labels for the rows of the Heatmap. -
columnLabels: string[]: Labels for the columns of the Heatmap. -
options: HeatmapSettings(optional): Can be used to configure the Heatmap before rendering. See below for all options that are currently supported.
By calling cluster() upon a previously constructed heatmap object, the rows and columns of the heatmap are clustered
using the UPGMA-algorithm, and reordered using the MOLO-heuristic. Rows are clustered first, then columns. The heatmap
will render an animation to reorder the different rows and columns (if animations are enabled) clearing up what happens
for the user. This function accepts one parameter:
-
toCluster: "all" | "columns" | "rows" | "none": Pass one of the accepted values to respectively cluster both rows and columns, only columns, only rows or nothing.
The complete visualization can be rerendered by calling reset().
Export the heatmap to SVG. This function produces a valid SVG-string that can directly be downloaded or rendered. Note that it can a significant time to perform this function for very large heatmaps. It's recommended to wrap this function in a Worker thread to avoid blocking the main UI-thread in that case. This method takes the following list of arguments:
-
fontSize: number = 14: Size of the font that should be used for the labels in the SVG-version of this visualization. -
squareDimension: number = 20: Width and height (in pixels) of one square in the produced heatmap. -
squarePadding: number = 2: Amount of space between squares in both the horizontal and vertical direction (in pixels). -
visualizationTextPadding: number = 4: Amount of space between the heatmap itself and the labels on both axes.
Resize the canvas and the embedded visualization without resetting all other state. If you need to change the dimensions of the heatmap without triggering the animations, you should use this method. The following arguments are required:
-
newWidth: number: Desired new width of the visualization (in pixels). -
newHeight: number: Desired new height of the visualization (in pixels).
A HeatmapValue object represents one value (or one grid) in the heatmap. This interface keeps track of the decimal value, row index, column index and color for one square of the grid.
-
value: Decimal value that is being rendered on the heatmap. -
rowId: Row index of the current position of this value in the heatmap grid. -
colId: Column index of the current position of this value in the heatmap grid. -
color: Color that's associated with this value.
A HeatmapSettings object can be used to fully configure the heatmap and specifies a variety of properties that can
be used to complete change the heatmap:
-
width: number(optional, default = 800): Maximum width of the visualization in pixels. -
height: number(optional, default = 800): Maximum height of the visualization in pixels. -
enableTooltips: boolean(optional, default = true): Are tooltips shown when hovering over an element in the heatmap? -
initialTextWidth: number(optional, default = 100): The amount of pixels that can maximally be used for row labels when initially rendering the heatmap. -
initialTextHeight: number(optional, default = 100): The amount of pixels that can maximally be used for column labels when initially rendering the heatmap. -
squarePadding: number(optional, default = 2): Padding between squares in the heatmap grid (in pixels). Set to 0 for no padding. -
visualizationTextPadding: number(optional, default = 4): Padding between the visualization and the labels (in pixels). This padding is applied to both the row and column labels. -
fontSize: number(optional, default = 14): Font size for labels, when current label is not highlighted. Size must be given in pixels. -
labelColor: string(optional, default = "#404040"): Color of label text, when label is not highlighted. Value should be a valid HTML color string (hexadecimal). -
highlightSelection: boolean(optional, default = true): Should the row, column and square that are currently being hovered by the mouse cursor be highlighted? -
highlightFontSize: number(optional, default = 16): Font size for labels, when current label is highlighted. Size must be given in pixels. -
highlightFontColor: string(optional, default = "black"): Color of label text, when label is highlighted. Value should be a valid HTML color string (hexadecimal). -
className: string(optional, default = "heatmap"): Classname that's internally used for the object. -
animationsEnabled: boolean(optional, default = true): Determines if animations should be rendered when rows and columns are reordered. -
animationDuration: number(optional, default = 2000): Determines how long animations should take, if they are enabled. Time should be given in milliseconds. -
transition: (number) => (number)(optional, default =Transition.easeInEaseOutCubic): Transition effect that should be applied to the reordering animation. Pass a predefined function from the Transition namespace, or provide your own function that maps a value from [0, 1] to [0, 1]. -
minColor: string(optional, default = "#EEEEEE"): Color value that should be used to render squares with the lowest possible value. All other values between min and max value will be colored with a color value interpolated between minColor and maxColor. Value should be a valid HTML color string. -
maxColor: string(optional, default = "#1565C0"): Color value that should be used to render squares with the highest possible value. All other values between min and max value will be colored with a color value interpolated between minColor and maxColor. Value should be a valid HTML color string. -
colorBuckets: number(optional, default = 50): How many distinct colors between minColor and maxColor should be used for the heatmap (this value thus determines the size of the color palette). Increasing this value will decrease the heatmap's performance. -
dendrogramEnabled: boolean(optional, default = false): Should a dendrogram be shown next to the rows and columns of the visualization? -
dendrogramWidth: number(optional, default = 100): Maximum amount of pixels that can be taken in by the dendrogram. -
dendrogramLineWidth: number(optional, default = 1): Width (in pixels) of each line in the dendrogram. -
dendrogramColor: number(optional, default = "#404040"): Color of the lines in the dendrogram (must be a valid HTML color string). -
clusteringAlgorithm: Clusterer(optional, default =UPGMAClusterer): Defines which clustering algorithm should be used. Must implement theClustererinterface. -
reorderer: Reorderer(optional, default =MOLOReorderer): Defines which reordering algorithm for the leaves of the clustering dendrogram should be used. Must implement theReordererinterface.
-
getToolTip(optional, default = generic tooltip function) Returns the html to use as tooltip for a cell. Is called with a HeatmapValue that represents the current cell and the row and column objects associated with the highlighted cell as parameters. The result of getTooltipTitle is used for the header and getTooltipText is used for the body of the tooltip by default. This function needs to return a string representing HTML-code that will be executed and receives 3 parameters:-
HeatmapValue: which represents the current cell over which the user is hovering. -
HeatmapFeature: an element that represents the current row over which the user is hovering. -
HeatmapFeature: an element that represents the current column over which the user is hovering. NOTE: Be very cautious in passing user input directly as a result of this function. Please always sanitize the user's input before returning it, as this might lead to reflected XSS-attacks.
-
-
getTooltipTitle(optional, default = generic title function) Returns text that's being used for the title of a tooltip. This tooltip provides information to the user about the value that's currently hovered by the mouse cursor. This function needs to return a string representing HTML-code that will be executed and receives 3 parameters:-
HeatmapValue: which represents the current cell over which the user is hovering. -
HeatmapFeature: an element that represents the current row over which the user is hovering. -
HeatmapFeature: an element that represents the current column over which the user is hovering. NOTE: Be very cautious in passing user input directly as a result of this function. Please always sanitize the user's input before returning it, as this might lead to reflected XSS-attacks.
-
-
getTooltipText(optional, default = generic body function) Returns text that's being used for the body of a tooltip. This tooltip provides information to the user about the value that's currently hovered by the mouse cursor. This function needs to return a string representing HTML-code that will be executed and receives 3 parameters:-
HeatmapValue: which represents the current cell over which the user is hovering. -
HeatmapFeature: an element that represents the current row over which the user is hovering. -
HeatmapFeature: an element that represents the current column over which the user is hovering. NOTE: Be very cautious in passing user input directly as a result of this function. Please always sanitize the user's input before returning it, as this might lead to reflected XSS-attacks.
-