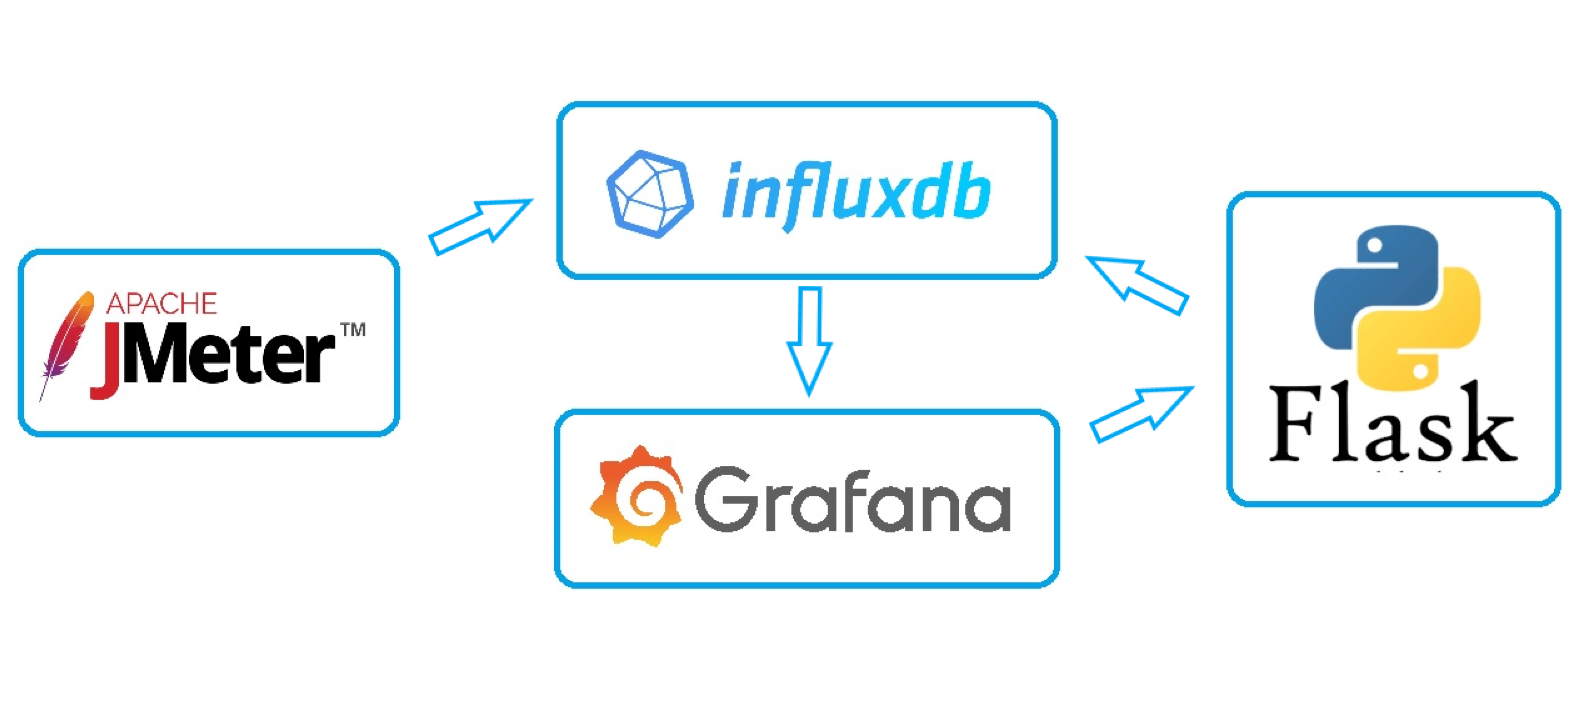
This repository contains everything you need to visualize and analyze the results of JMeter testing.
- Grafana dashboards that allow you to manage test data in influxdb and compare different tests.
- Python service that makes buttons clickable in Grafana and allows you to create reports in the Azure wiki.
Now about the structure:
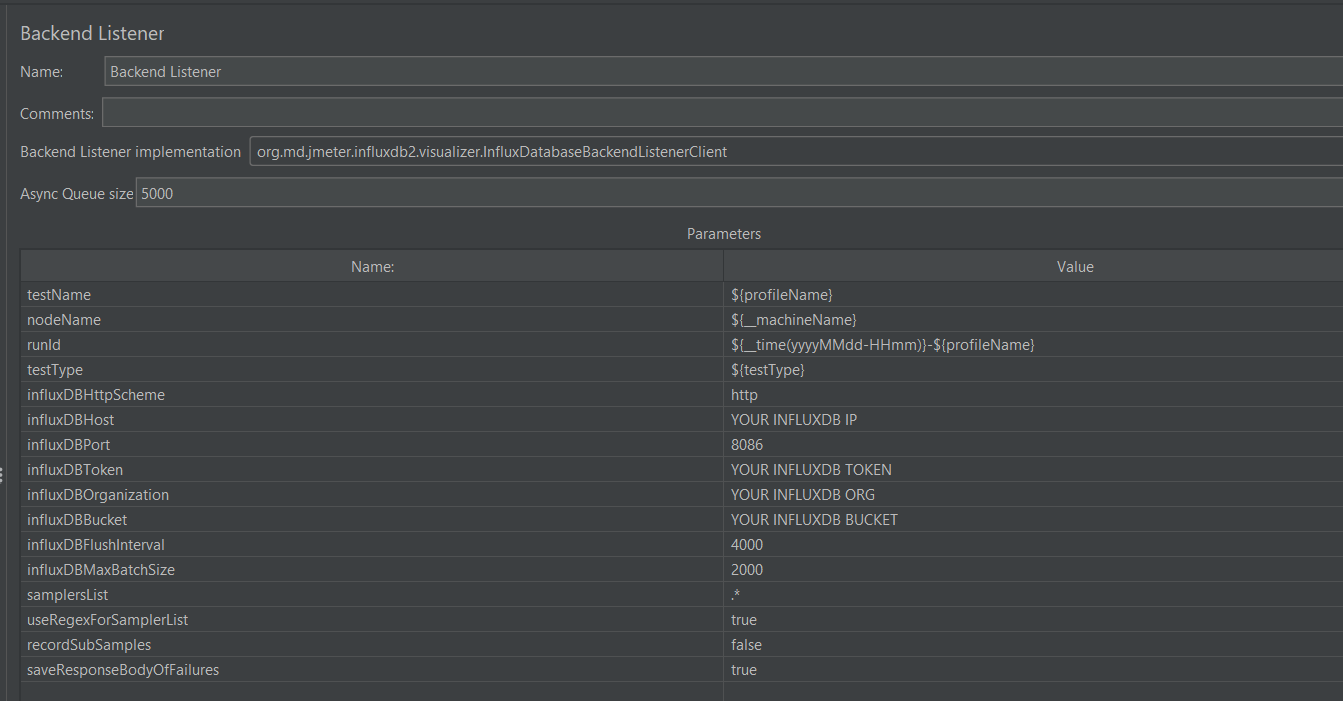
- backendListener folder contains custom backend listener to send metrics to influxdb 2.
- grafanaDashboards folder contains 3 grafana dashboards for different purposes.
- flaskPerf folder contains python code of Flask server to make grafana buttons responsive.
- JMeter 5.4.3^
- InfluxDB 2.0^
- Grafana 8.1.2^
- Java 11
Note that grafana dashboards and the python service will only work with the provided JMeter backend listener. Other listeners can send JMeter data with different field/tag names, which will require you to modify the dashboards and python code.
The plugin sends the following metrics to InfluxDB:
- Response code
- Error message
- Response body of the failed requests (can be configured);
- Connect time
- Latency
- The response time
- Type of the sample: transaction/request (It is very easy to split JMeter metrics by sampler type without the need for special names and regular expressions)
- First you need to put the backend-listener plugin to JMeter /lib/ext/ folder.
- Fill in all required fields:
If you will use the provided docker compose file. Grafana with all plugins will be installed automatically. If you want to install it in some other way or use some existing Grafana. You need to make sure that the following plugins are installed:
- cloudspout-button-panel
- grafana-image-renderer
To install plugins manually, run the following command: grafana-cli plugins install grafana-image-renderer (example)
- First you need to install Docker Engine according to one of these instructions: Link
- The next step is to install Docker Compose: Link
- Copy folder flaskPerf and docker-compose file on your server (Note that the docker compose file must be in the same location as the flaskPerf folder)
- Go to the folder with docker-compose file
- Run the followng comand: docker-compose up -d (It will automatically install all tools and plugins)
- First you need to install Docker Engine according to one of these instructions: Link
- The next step is to install Docker Compose: Link
- Copy folder flaskPerf and docker-compose file which stores only flask service on your server (Note that the docker compose file must be in the same location as the flaskPerf folder)
- Go to the folder with docker-compose file
- Run the followng comand: docker-compose -f docker-compose-only-flask.yml up -d (It will automatically install all tools and plugins)
- Copy folder flaskPerf on your server
- Install python (The service was developed using python 3.9)
- Install all the necessary dependencies. Run command: pip3 install --upgrade pip -r requirements.txt
- Start flask service: python ./start.py
- When all components are installed and running. First you need to add influxdb as a data source in Gfafana. Note, Flux should be chosen as a query language.

- Then you need to import dashboards into Grafana. When importing dashboards, do not change the uid, this will break the connection between the dashboards.

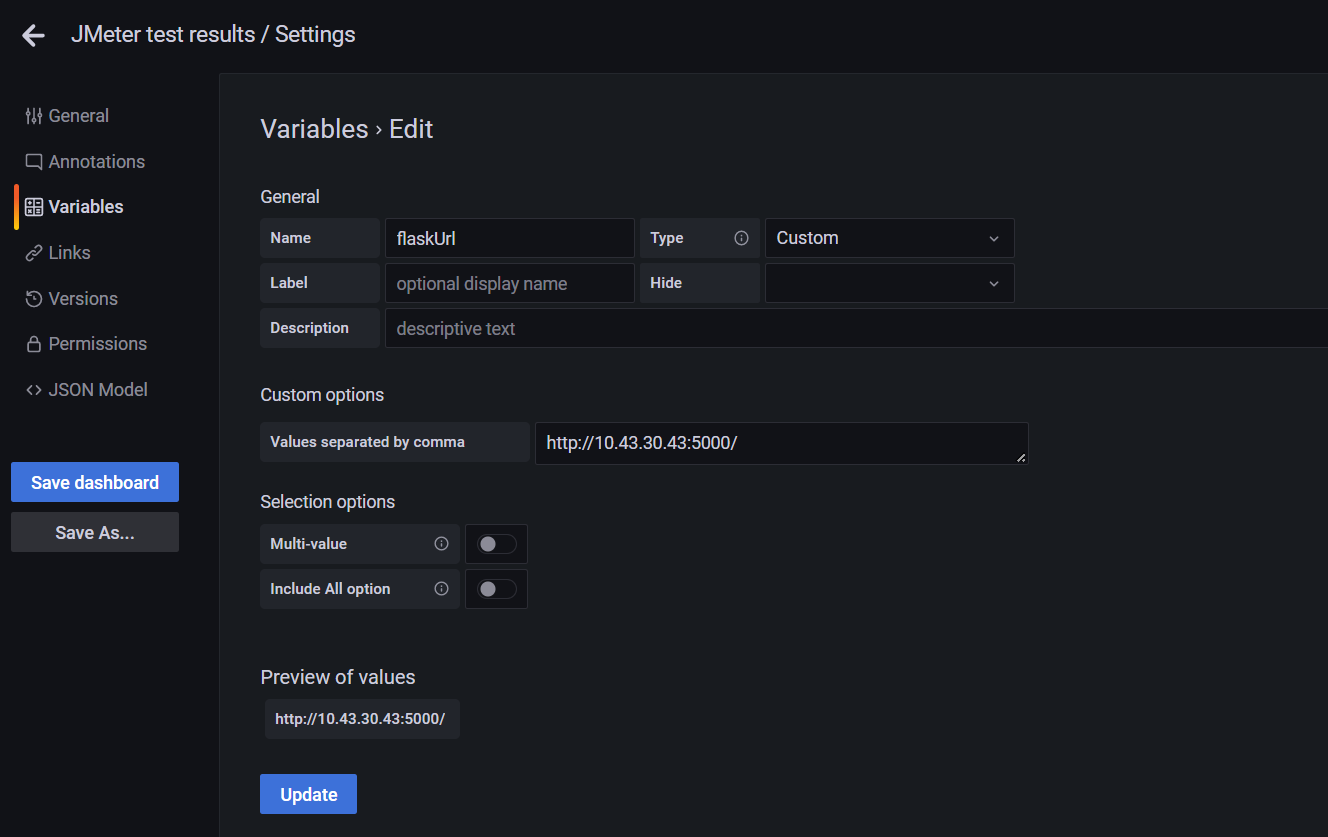
- Then update the flaskUrl variable, it should store a link to the Flask service. This variable is used in buttons. For example:
- Then you need to update Flask configuration files. All config files are located in config folder.
- config.json: Here you need to update your Influxdb and Grafana data. Azure is only used for automatic wiki reporting. This will be described later.

- influxdb.ini: Here you need to update your Influxdb data.

- users.csv: This file stores Grafana users who have access to the Flask service.

- After updating the configuration files, restart the Flask service.
- Now you can run tests and enjoy :)
The main dashboard contains 2 tables and trend bar charts:
- Test log table: which displays each test and creates a link to a separate dashboard with test results and a link to a comparison panel for comparison with the baseline.
- Baselines table: represents latest baselines for each test name and test type.
- Trend bar charts allow you to see how the mean, median, and 90 percentile change from test to test.
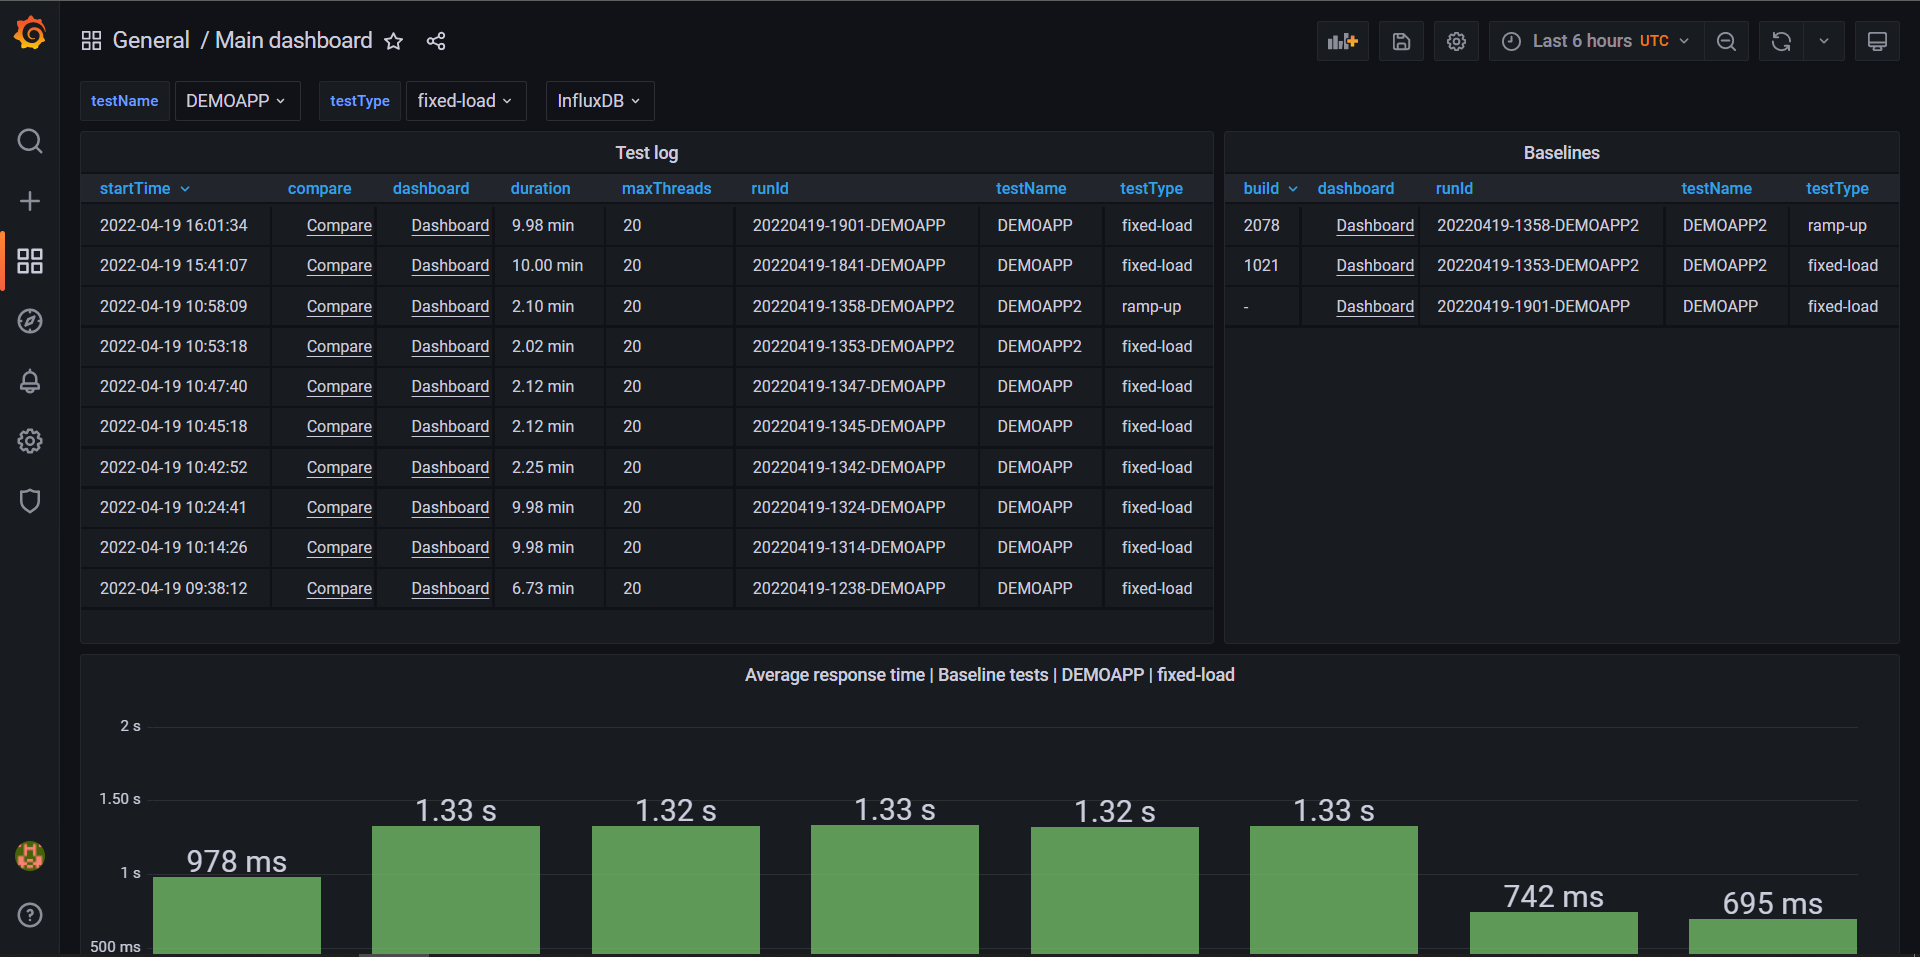
This dashboard visualizes all JMeter metrics. Also on top of the dashboards there are several buttons:
- You can mark the test results as a baseline. To do this, please enter the application build number or leave it blank. Then click on the "Mark as a baseline" button. After it, test will be displayed in Baseline table on main dashboard.
- You can delete the test status, this means that the test will be without identifier (baseline).
- Or you can completely delete test results.

This dashboard is used to compare the current test results with the baseline.
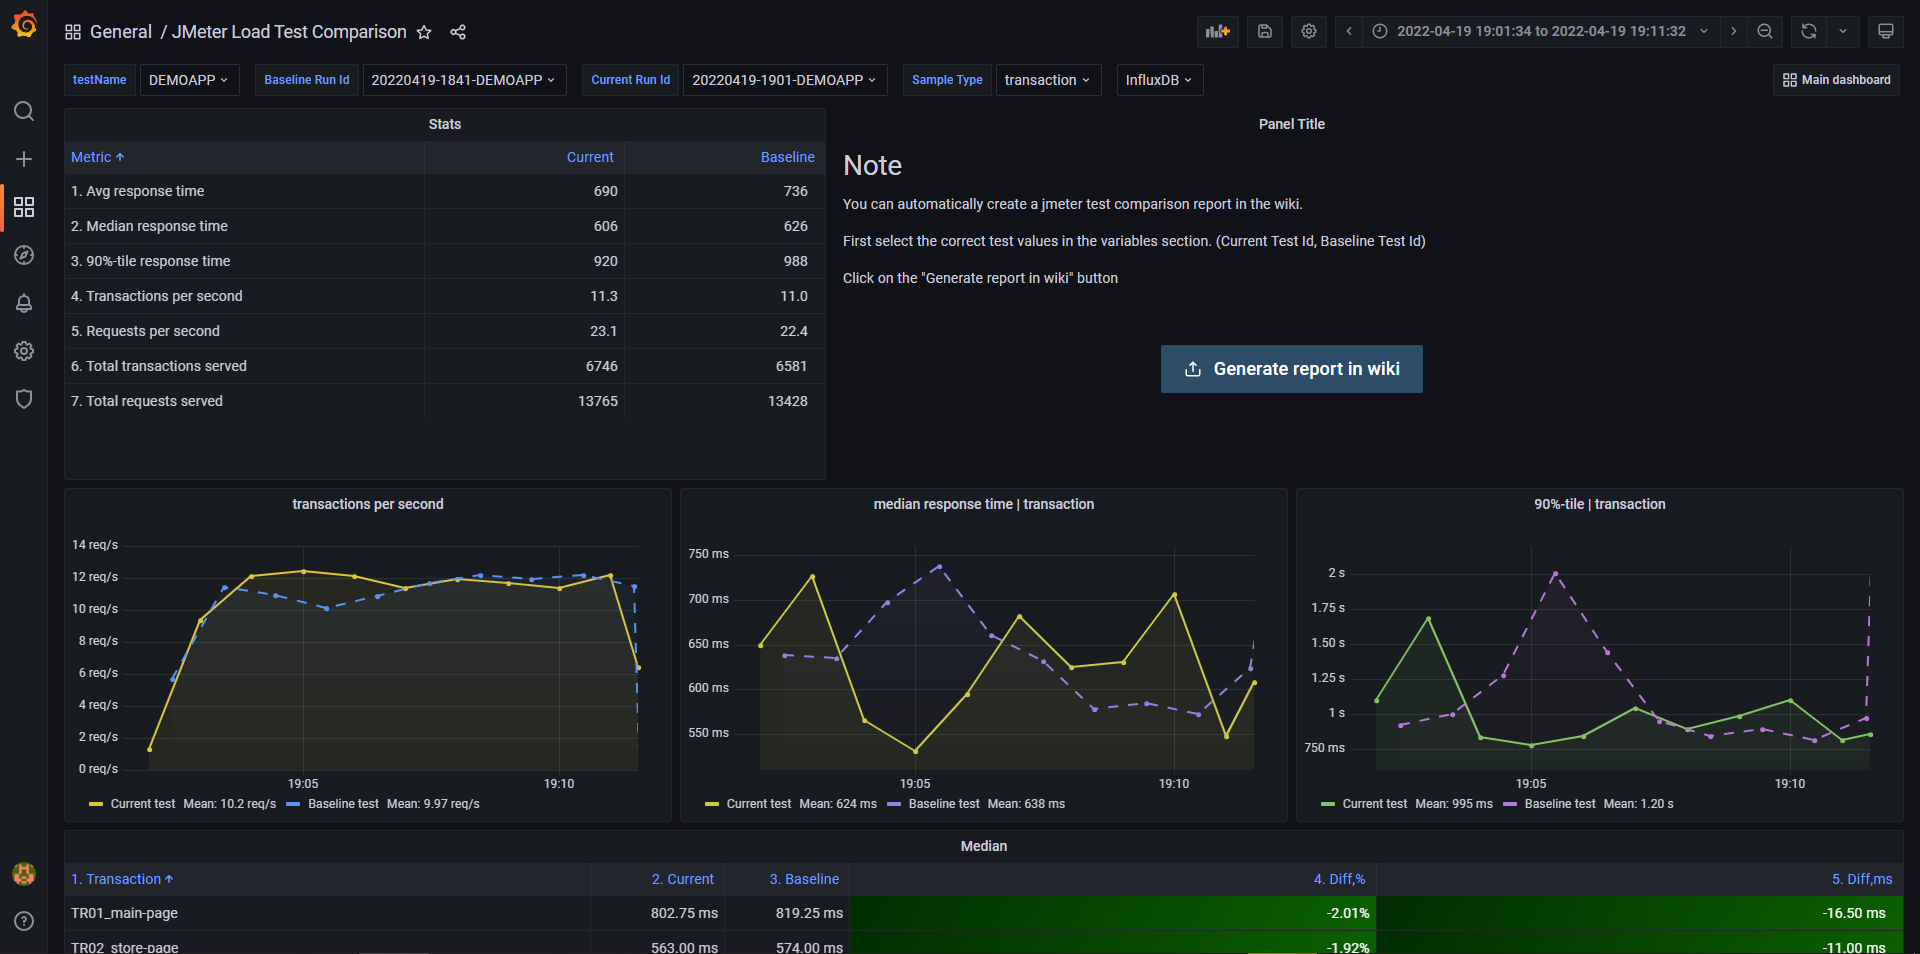
It is very easy to find the required time range of the test. You just need to click on the generated link in the test log table and it will automatically redirect you to a dashboard with a predefined time range of your test.

Sometimes we need to mark a particular test as a baseline or save build id of the application under test. To do this, you need to enter the build id in the text field and click the "Mark as a baseline" button.

In case you made a mistake while saving the baseline, you can easily delete this status and reset it again.

Sometimes we can conduct experimental or warm-up tests that we don't have to store in the database. In such cases, you can delete the test from influxdb by clicking on the "Delete test results" button.

To compare the test results, first of all, you need to mark at least one baseline test. Then you can click on the "compare" link in the test log, it will redirect you to the comparison dashboard, automatically comparing the test results with the latest baseline.

You can also go to the comparison panel by clicking on the "Compare" button on the test results dashboard.

- First you need to update the data for integration with azure in config.json file:

- To get azure_personal_access_token:
- open azure devops
- Click on "User settings"
- Click on "Personal Access Tokens"
- Create token with read/write permissions to wiki

- To get azure_wiki_organization_url copy it from url

- azure_wiki_project it is your project name
- azure_wiki_identifier = azure_wiki_project + '.wiki'
- azure_wiki_path it is path to parent folder, where reports should be located. For example in this case it will be "/DEMO-TESTS/JMETER-REPORTS"

- Now we need to configure which screenshots we need to add to our report. To do this, you need to add the panel data to the screenshots.json file.

- In the "Hardware metrics" section, we also need to specify the name of the test. Since sometimes different applications can have different environments, we can monitor different metrics.

- When everything is set up, you can now restart Flask service. Open comparison dashboard and click "Generate report in wiki".

- The report will look like this
