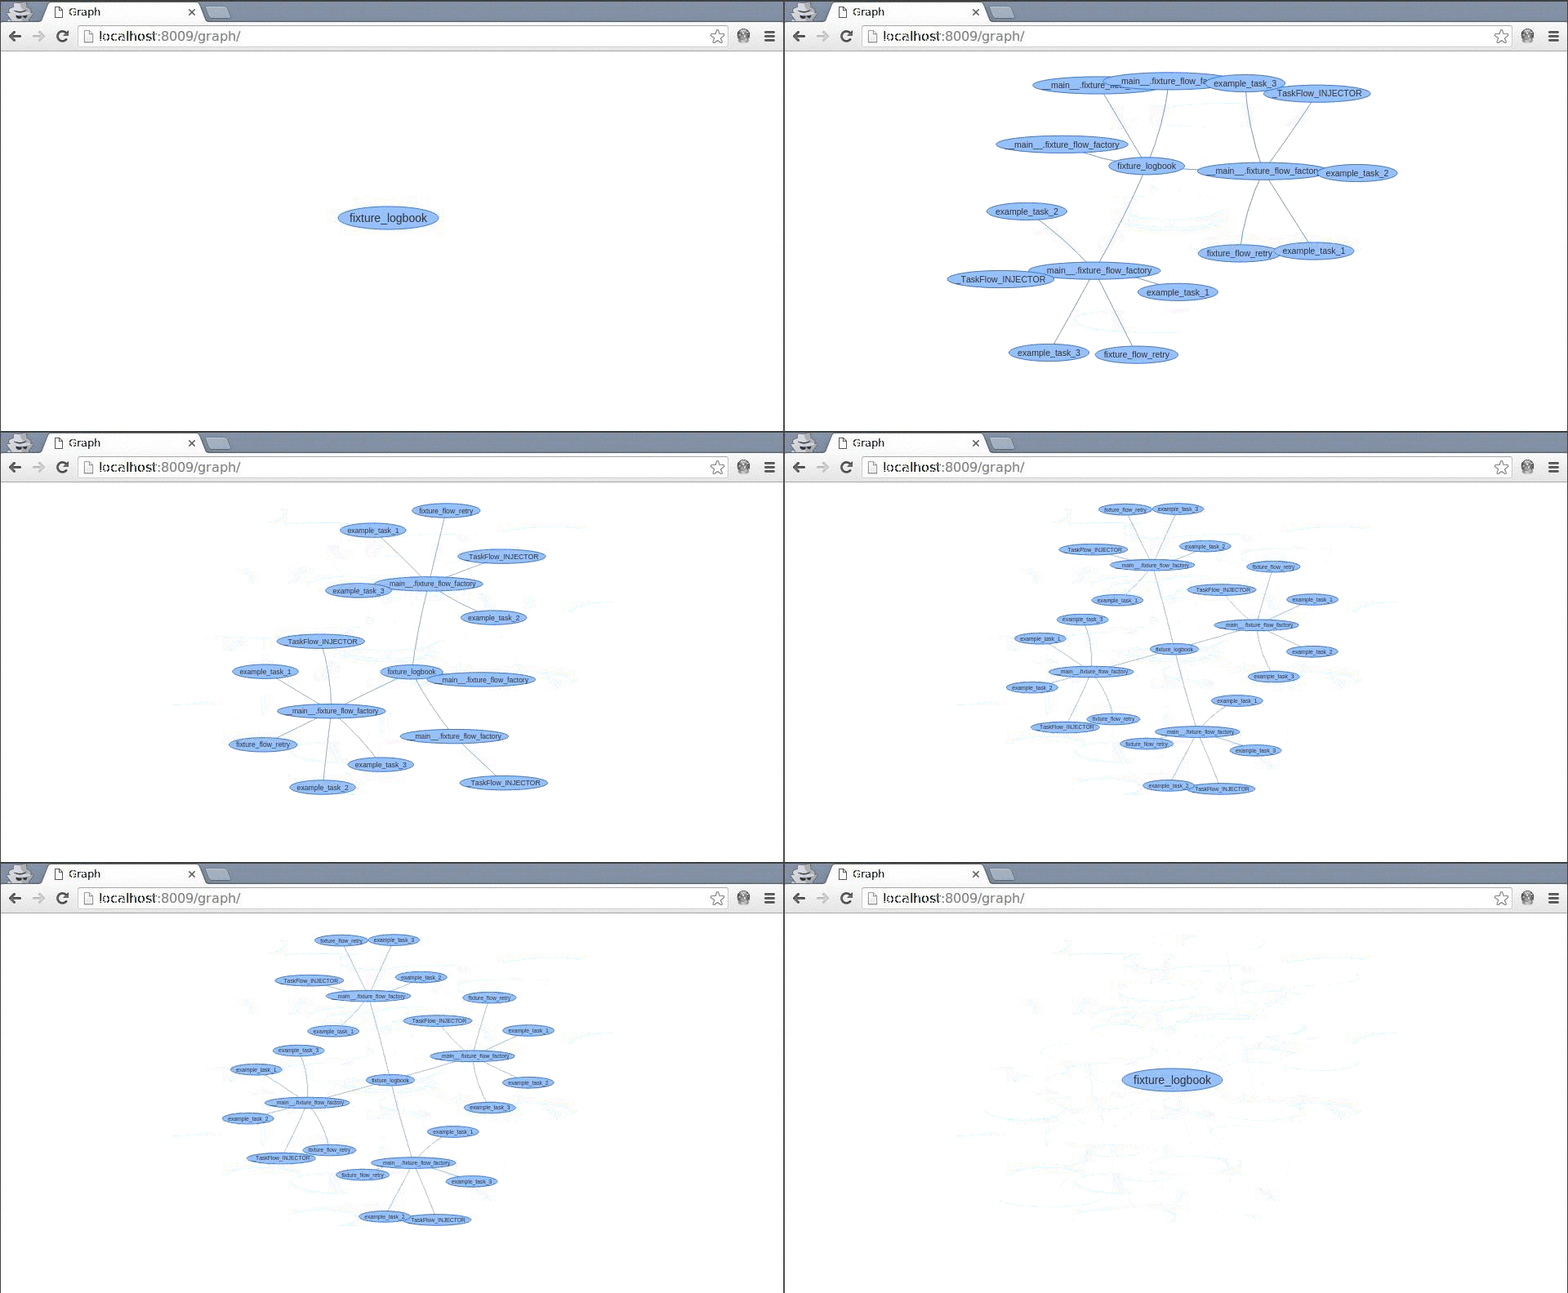
Proof of concept for visualizing the Openstack TaskFlow persistence backend using React.js and vis.js.
Don't mind the substandard code and lack of tests, this was just a small project to familiarize myself with a modern Javascript toolchain over the weekend.
Stuff:
Make sure you have the requirements installed
node, npm, make, python3, pip
Run the server
make  # Install the dependencies and generate a fixture
make run  # Run the webserver
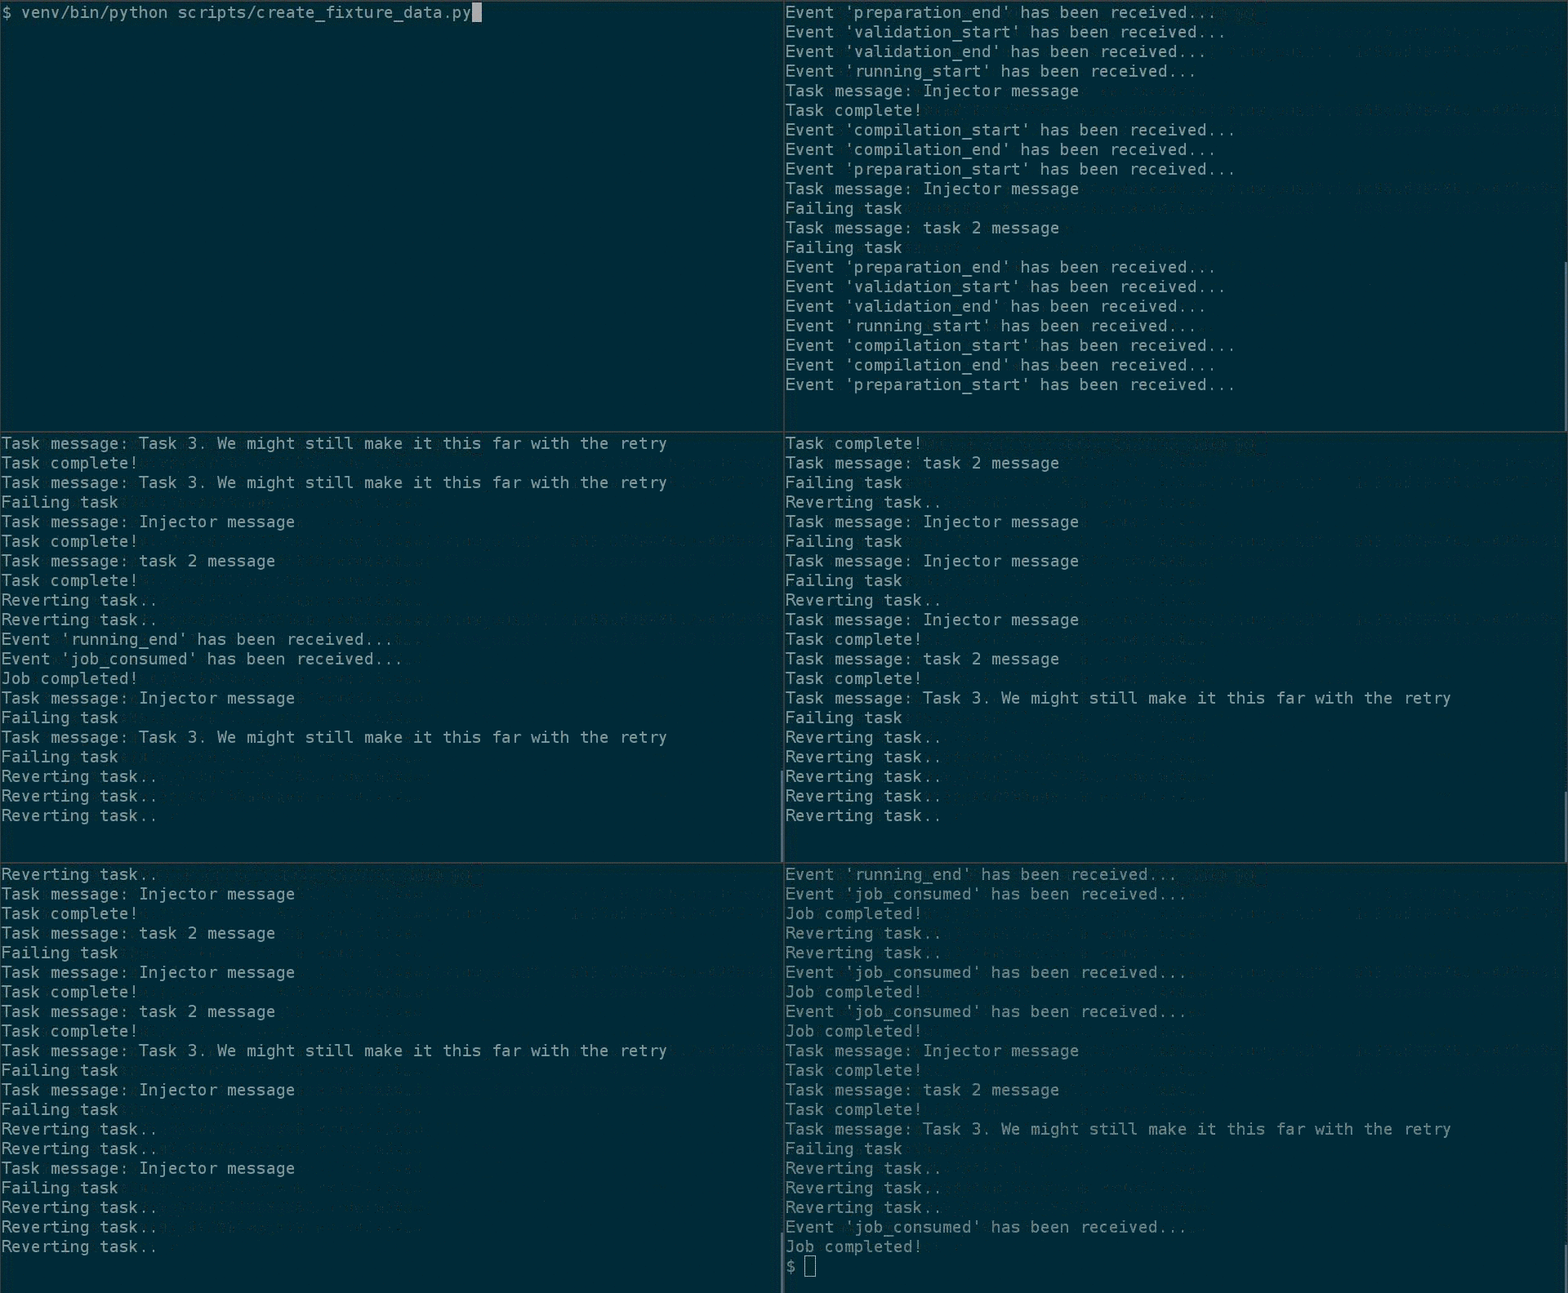
You can then manually re-run the flow simulation using
venv/bin/python scripts/create_fixture_data.pyAnd watch the following URL in the browser:
http://localhost:8009/graph/
