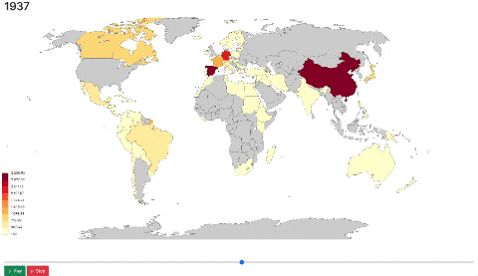
An interactive map that visualizes where the NYTimes has focused its international coverage — spanning from 1852-2020.
- Python 3.x
- Node.js >= 16
npm install

npm start
This visualization relies entirely upon data supplied by NYTime's Archive API.
While the data has already been retrieved and saved in the repo as CSV files, you can recreate the data retrieval process as follows:
# Register for an NYT Developer API key and follow the instructions found at: https://developer.nytimes.com/get-started

python -r requirements.txt

# The following script will take upwards of 3 hours to run due to API rate limiting constraints. Maybe watch a movie while you wait?

API_KEY={YOUR API KEY HERE} python data_collection/api.py

python data_collection/transform_data.py