![]()
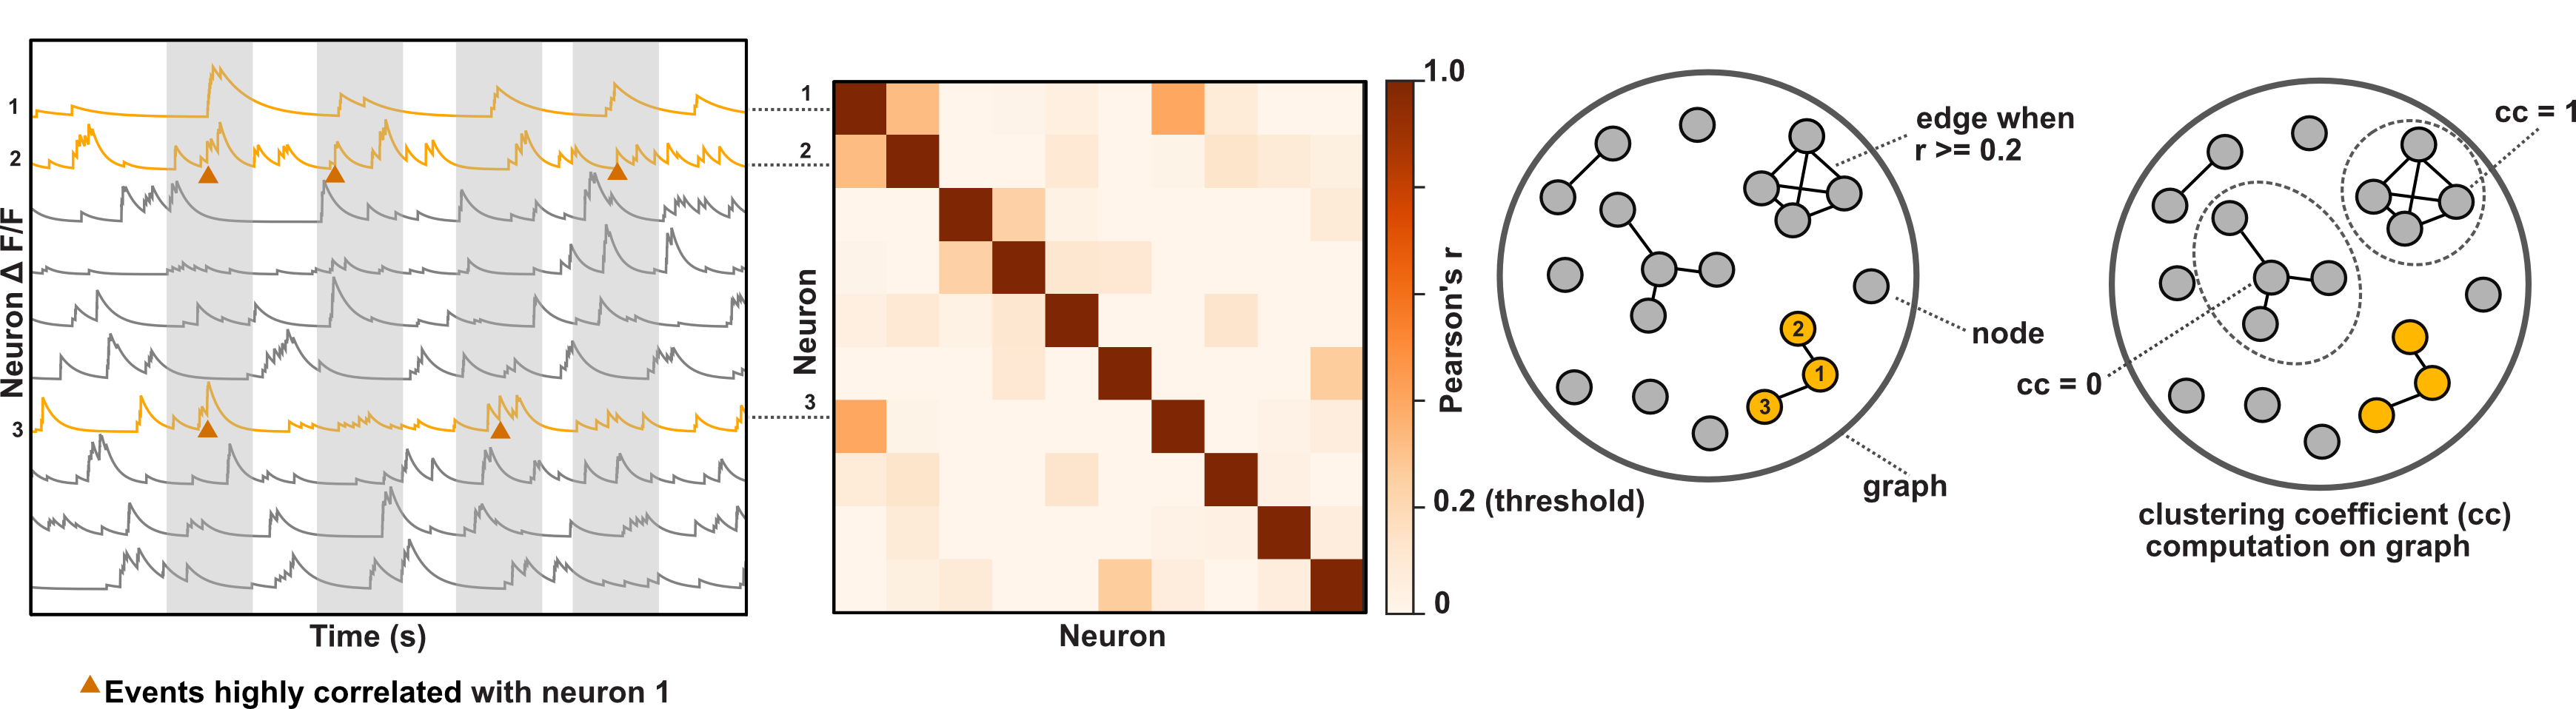
Graph theory analysis and visualization package for calcium imaging timeseries data. The package makes it simple for experimental researchers to generate graphs
of functional networks and inspect their topology, using NetworkX to compute useful graph theory metrics. Bokeh is used to assist with interactive plotting of graph networks.
Explore the docs »
View Demo
·
Report Bug
·
Request Feature
To get a local copy up and running follow these simple steps.
A list of software required for the CaGraph project and how to install the packages.
- networkx
pip install networkx
- bokeh
pip install bokeh
- numpy
pip install numpy
- matplotlib
pip install matplotlib
- pynwb
pip install pynwb
- scipy
pip install scipy
- seaborn
pip install seaborn
- statsmodels
pip install statsmodels
- Clone the repo
git clone https://github.com/vporubsky/CaGraph.git
- Install via PyPI
pip install cagraph
Examples of using the package will be added here. Additional screenshots, code examples and demos will be included formally in documentation.
Documentation to be added.
Distributed under the MIT License. See LICENSE for more information.
Veronica Porubksy - verosky@uw.edu
Project Link: https://github.com/vporubsky/CaGraph