-
Notifications
You must be signed in to change notification settings - Fork 46
New issue
Have a question about this project? Sign up for a free GitHub account to open an issue and contact its maintainers and the community.
By clicking “Sign up for GitHub”, you agree to our terms of service and privacy statement. We’ll occasionally send you account related emails.
Already on GitHub? Sign in to your account
add a graph showing the relationship of stats to the spec #348
Comments
|
Here's a version of the picture linked above that doesn't have black lines indicating what is directly or indirectly referenced from the RTP streams: |
|
The graphs shown in #350 sound like a more maintainable approach than hand-drawing them. |
|
@balazskreith is taking responsibility for this. When it is ready, we will need someone from W3C to vet the licenses on the dependency libs |
|
There's also this slide from March 2017, though some of the dictionary names have changed since (click the map link for my brain dump at the time). |
|
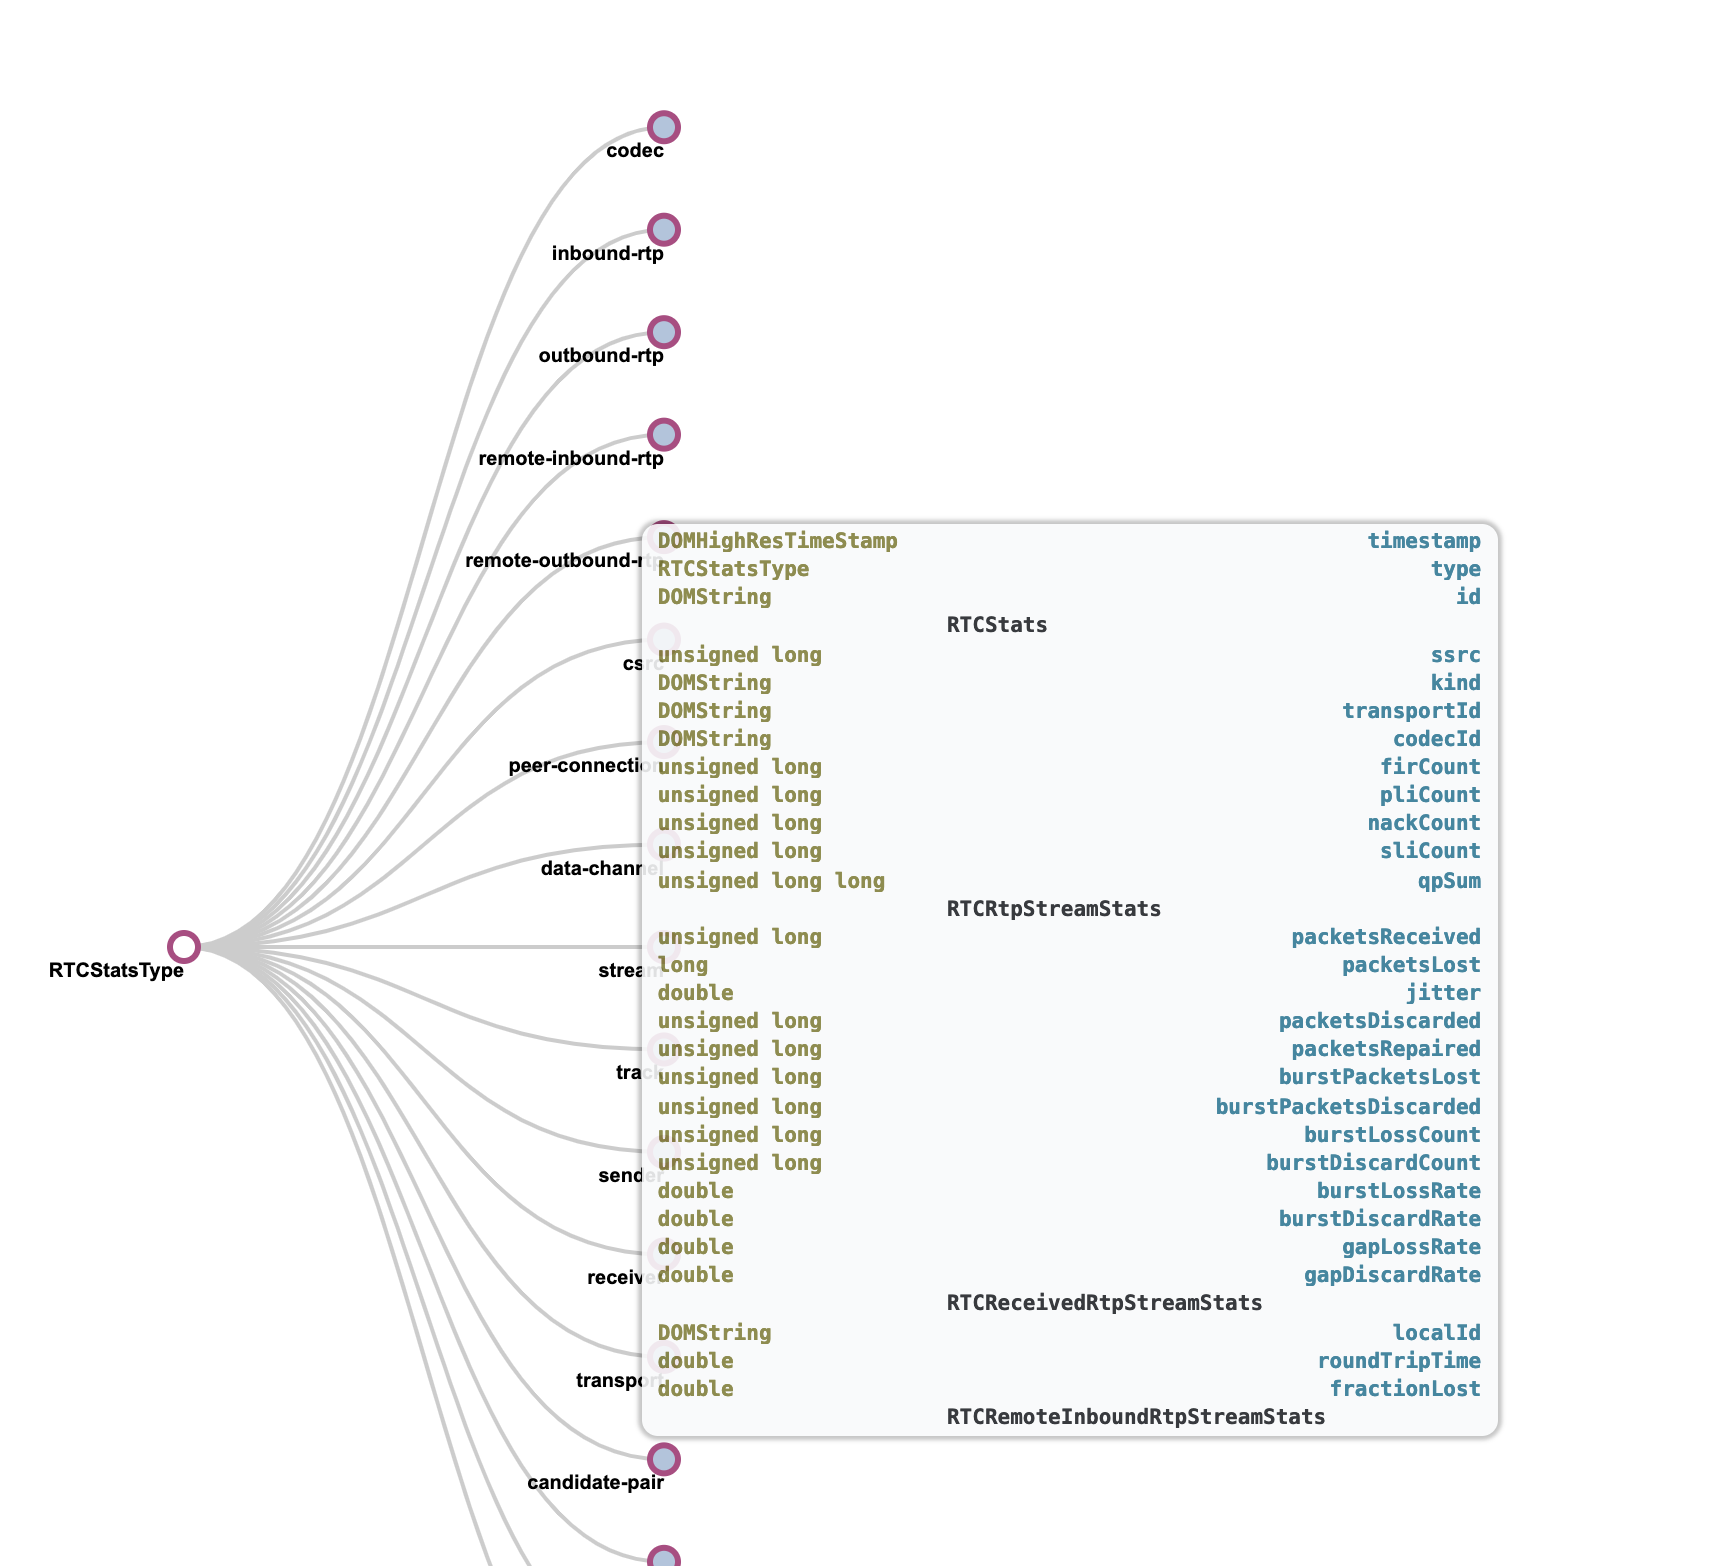
@pallab-gain and @karthikbr82 put together an interactive graph: https://webrtc-stats.callstats.io/graph/ @henbos @alvestrand @jan-ivar comments and feedback appreceiated. |
|
Beautiful! |
|
@MoeRT09 Thanks for producing this. This is good stuff. For this issue, What we need for the spec should show the interlinking of the objects. |
|
This was fixed by @dontcallmedom with the summary table, closing |

@henbos has done a whiteboard drawing of the current stats graph which I find very useful:
https://photos.app.goo.gl/6P0i4AV1E3szctTl1
Would be great to add this to the spec too as it explains some of the concepts much better than two pages of text could
The text was updated successfully, but these errors were encountered: