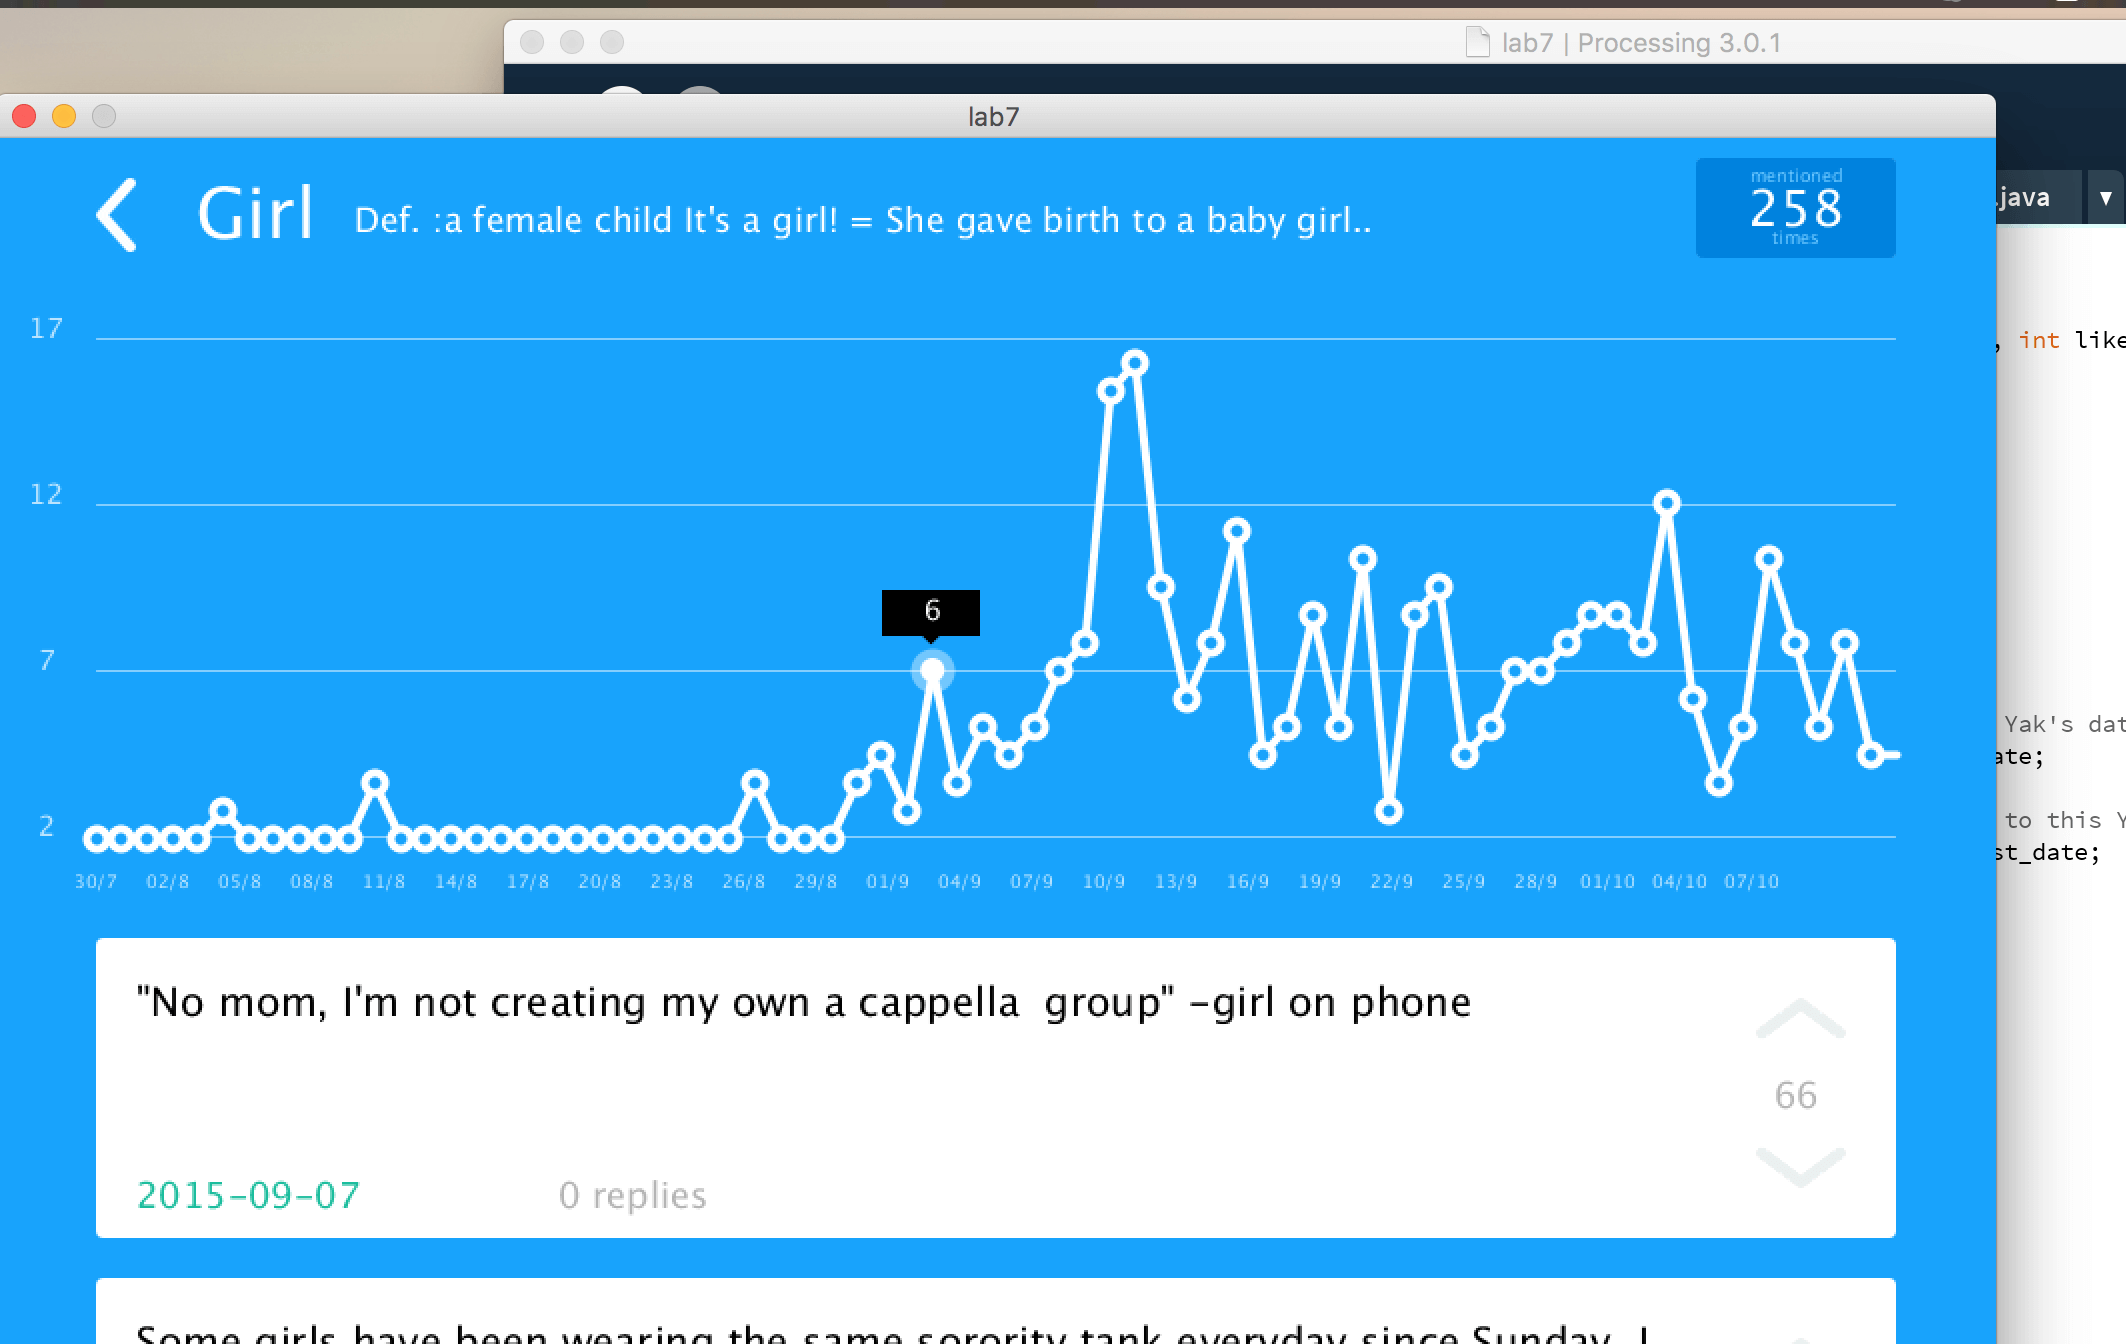
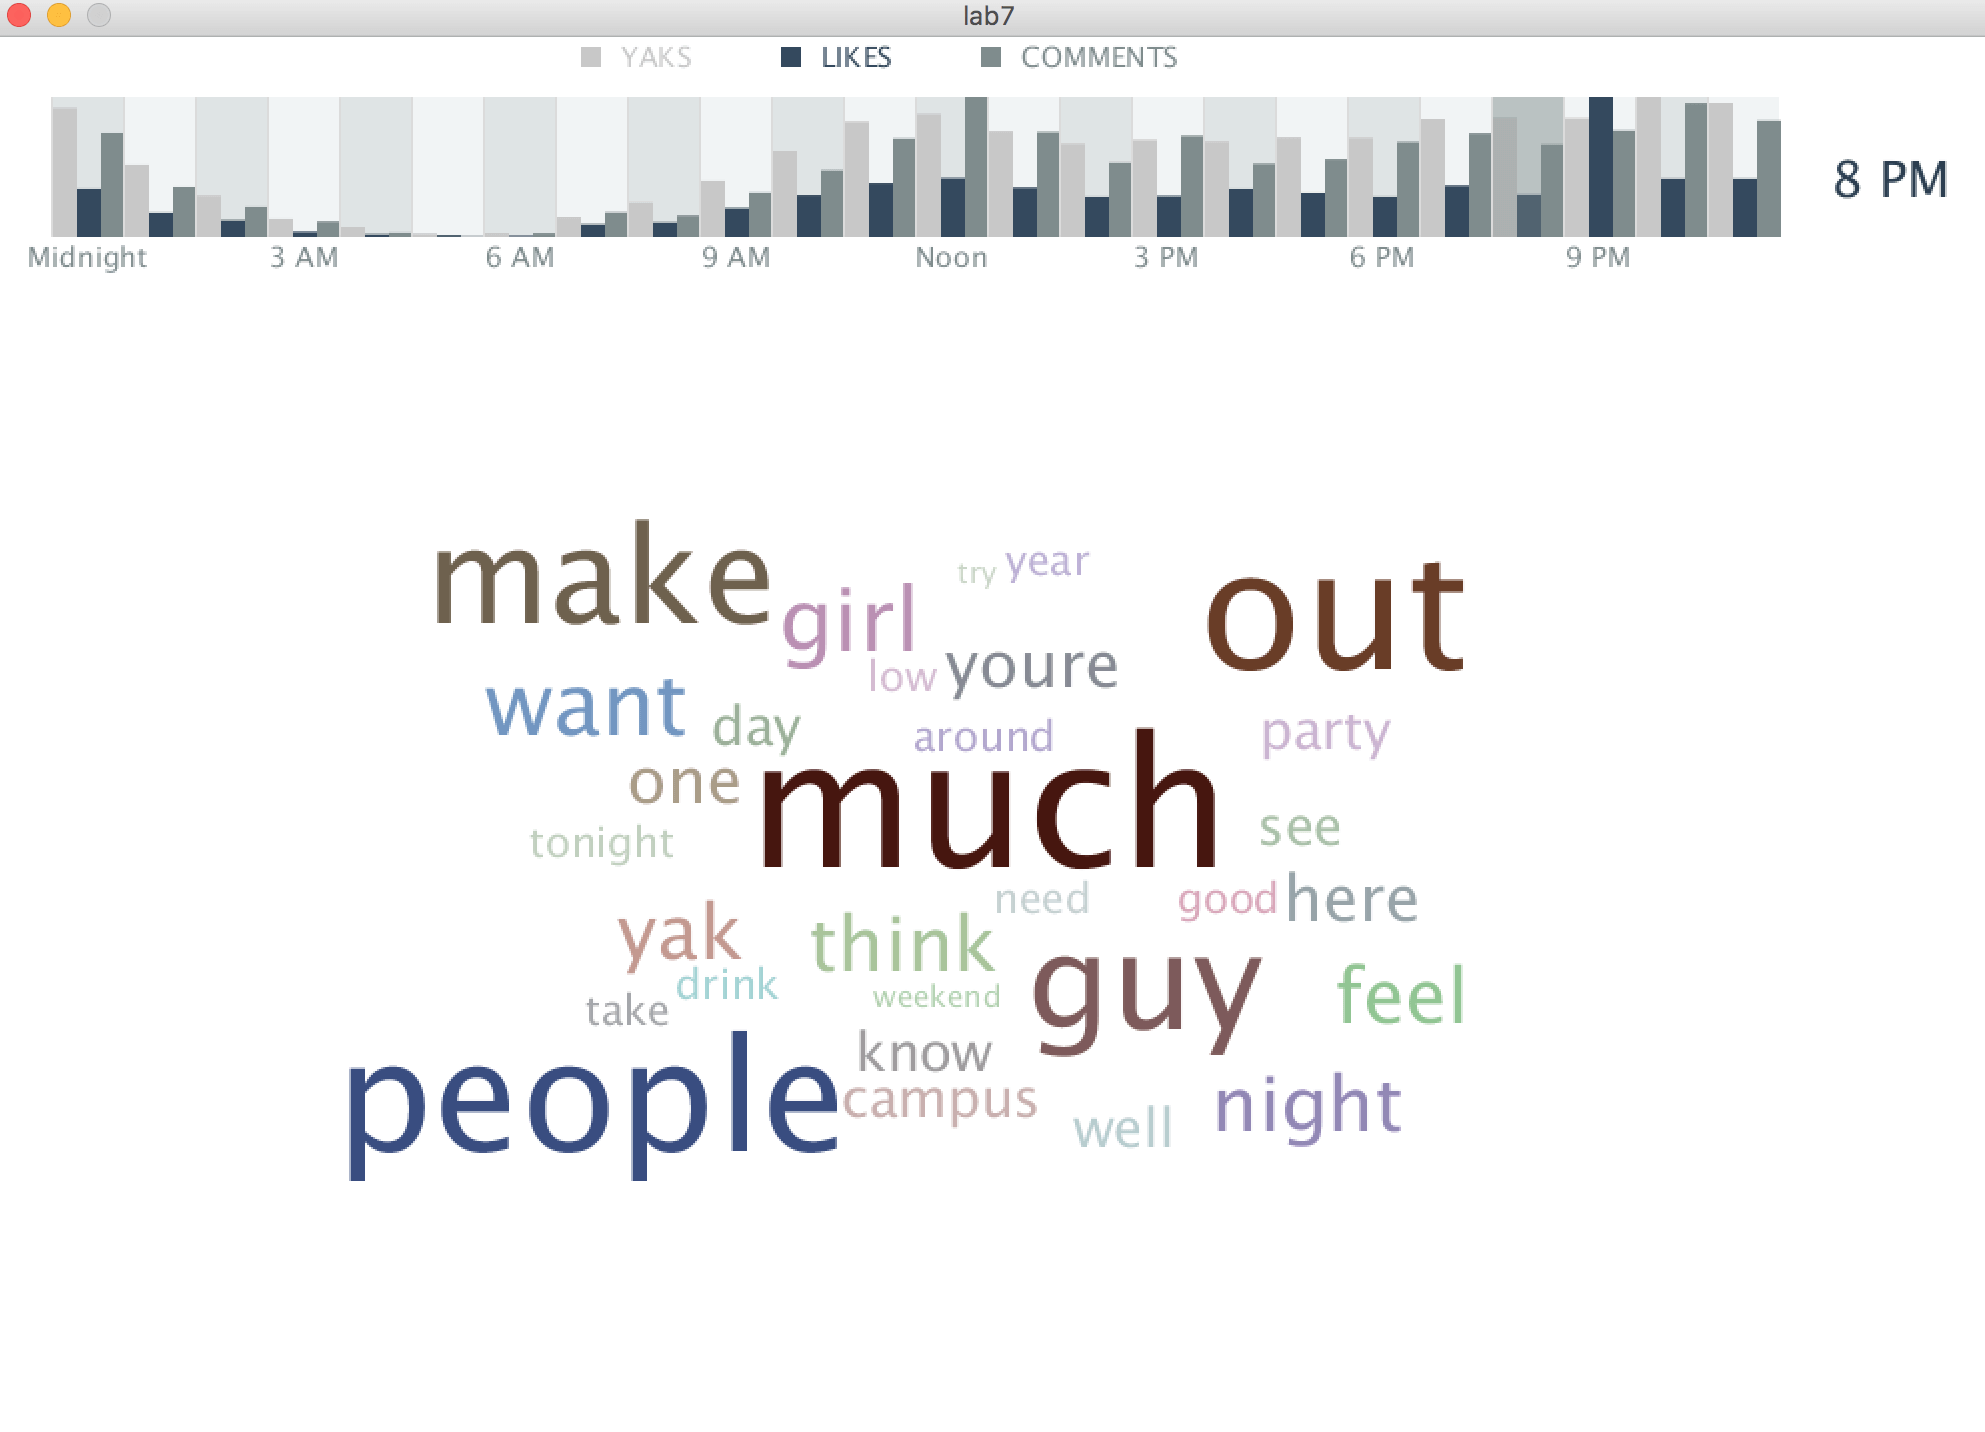
The visualization demonstrates the correlation between time of day and yik yak usage, through the number of yaks, comments, and likes collected at each hour. At the top of the window, the user sees a bar graph that shows the hourly numbers of the three categories. With time of day on the x-axis and number of item on the y-axis, the bar graph allows the user to see at what time of day each of the three activities peaks and the general activity trend. When the user hovers over an hour of the chart with the mouse, a word cloud comprised of the words most used during that hour appears. Furthermore, when a user clicks on one of the words of the word cloud, the screen displays information about that word's usage in the collection of yik yaks. At the top of that screen shows the word selected, and below that is a chart of the frequency of the word by date (as organized by: day, month, year). Below the chart are all of the yaks that include the word. Therefore, the controls the user has include both selecting word cloud by hour and collecting broader information on any word seen in a word cloud.
The specific challenges faced include finding the frequency of a word by date and generating a word cloud in which the individual words displayed do not overlap each other. The challenge of finding frequency of the word by date was the necessity of both categorizing the yaks by day, month, and year, but also to split each individual yak into separate words. Each yak needed to be separated into words because a yak could include the input word more than once, and each word needed to be counted individually. That challenge was overcome by searching through the array of yaks inside of a for loop, and with an if statement, determining if the input day, month, and year, equaled the day, month, and year of the yak with get methods. Then, that yak would be split into different words, and the equality of each word of the yak to the input String word would be tested. When a match was found, it would increase the int frequency, which is the return of the method and represents the frequency of a word on a single day. The word cloud was fixed using boxes to test spatial availability. The computer would place a green box around words that were placed in a random location and didn't overlap with any other words, and red boxes were placed in locations tested that already overlapped with other words. Then, the word would only be placed in the randomly selected location if the box was green, indicating it didn't overlap. Additionally, the words needed to be placed in order from largest size to smallest.
An interesting observation gained from the visualization is the trend of yaks, comments, and likes throughout the day. Yaks, comments, and likes all reflect two periods of high activity: around noon and around seven PM. There is little activity between the hours of midnight and ten AM. Another interesting observation is the most frequent words used in the collected yaks, as demonstrated by the word cloud. Unsurprisingly, profanity is highly used, especially at night. In the morning, especially at nine AM and again at noon, "class" is highly used. Squirrels are also a frequent topic at those hours. By five PM, the conversation shifts from day topics to those of the night, including "party," "netflix" and "chill", sororities and fraternities.
The system could be extended or refined with more resources and time in a few ways. One way to refine the project would be to color words and time periods based on the mood of the yak. Methods that determined the "happiness level" of the yak would be written, and the color of the words in those yaks would be set appropriately: on a spectrum from green to red, the happier colors would be more green and the angrier colors would be more red. Collecting a larger number of yaks, or from additional locations, would also provide a larger data sample. A way to extend the project would be to display an additional correlation, between a number of yaks' likes and the yaks' word count. That information would be displayed through a chart with number of likes on the y-axis and number of words in the yak on the x-axis.