Remove DagreD3 to make a solid foundation for the graph #2476
Conversation
|
Zoom is back Zoom.mov |
|
Drag is back - the scaling isn't perfect (your mouse doesn't move 1:1 with the graph) but it's close enough imo. Drag.mov |
12feee9
to
f456c1b
Compare
|
Great work @joshri |
|
Great job, @joshri ! The code is much simpler, cleaner, and easier to modify than with the Dagre library. A couple of minor issues:
graph_1.movBesides, at the 0 I suggest mapping the If this/a similar solution works, then
graph_2.movI haven't looked how to make the graph maintain its position while being zoomed after dragging and I'm not sure if it is important to fix right now, but movement "on a curve" should be related to this line: |
ce043b4
to
6f7f1e9
Compare
|
Cool, much simpler fix than what I suggested. 🎉
Great fix, can confirm that the graph now maintains drag position on zoom. |
|
The code looks fine to me. I only see a few minor issues remaining.
Old:
New:
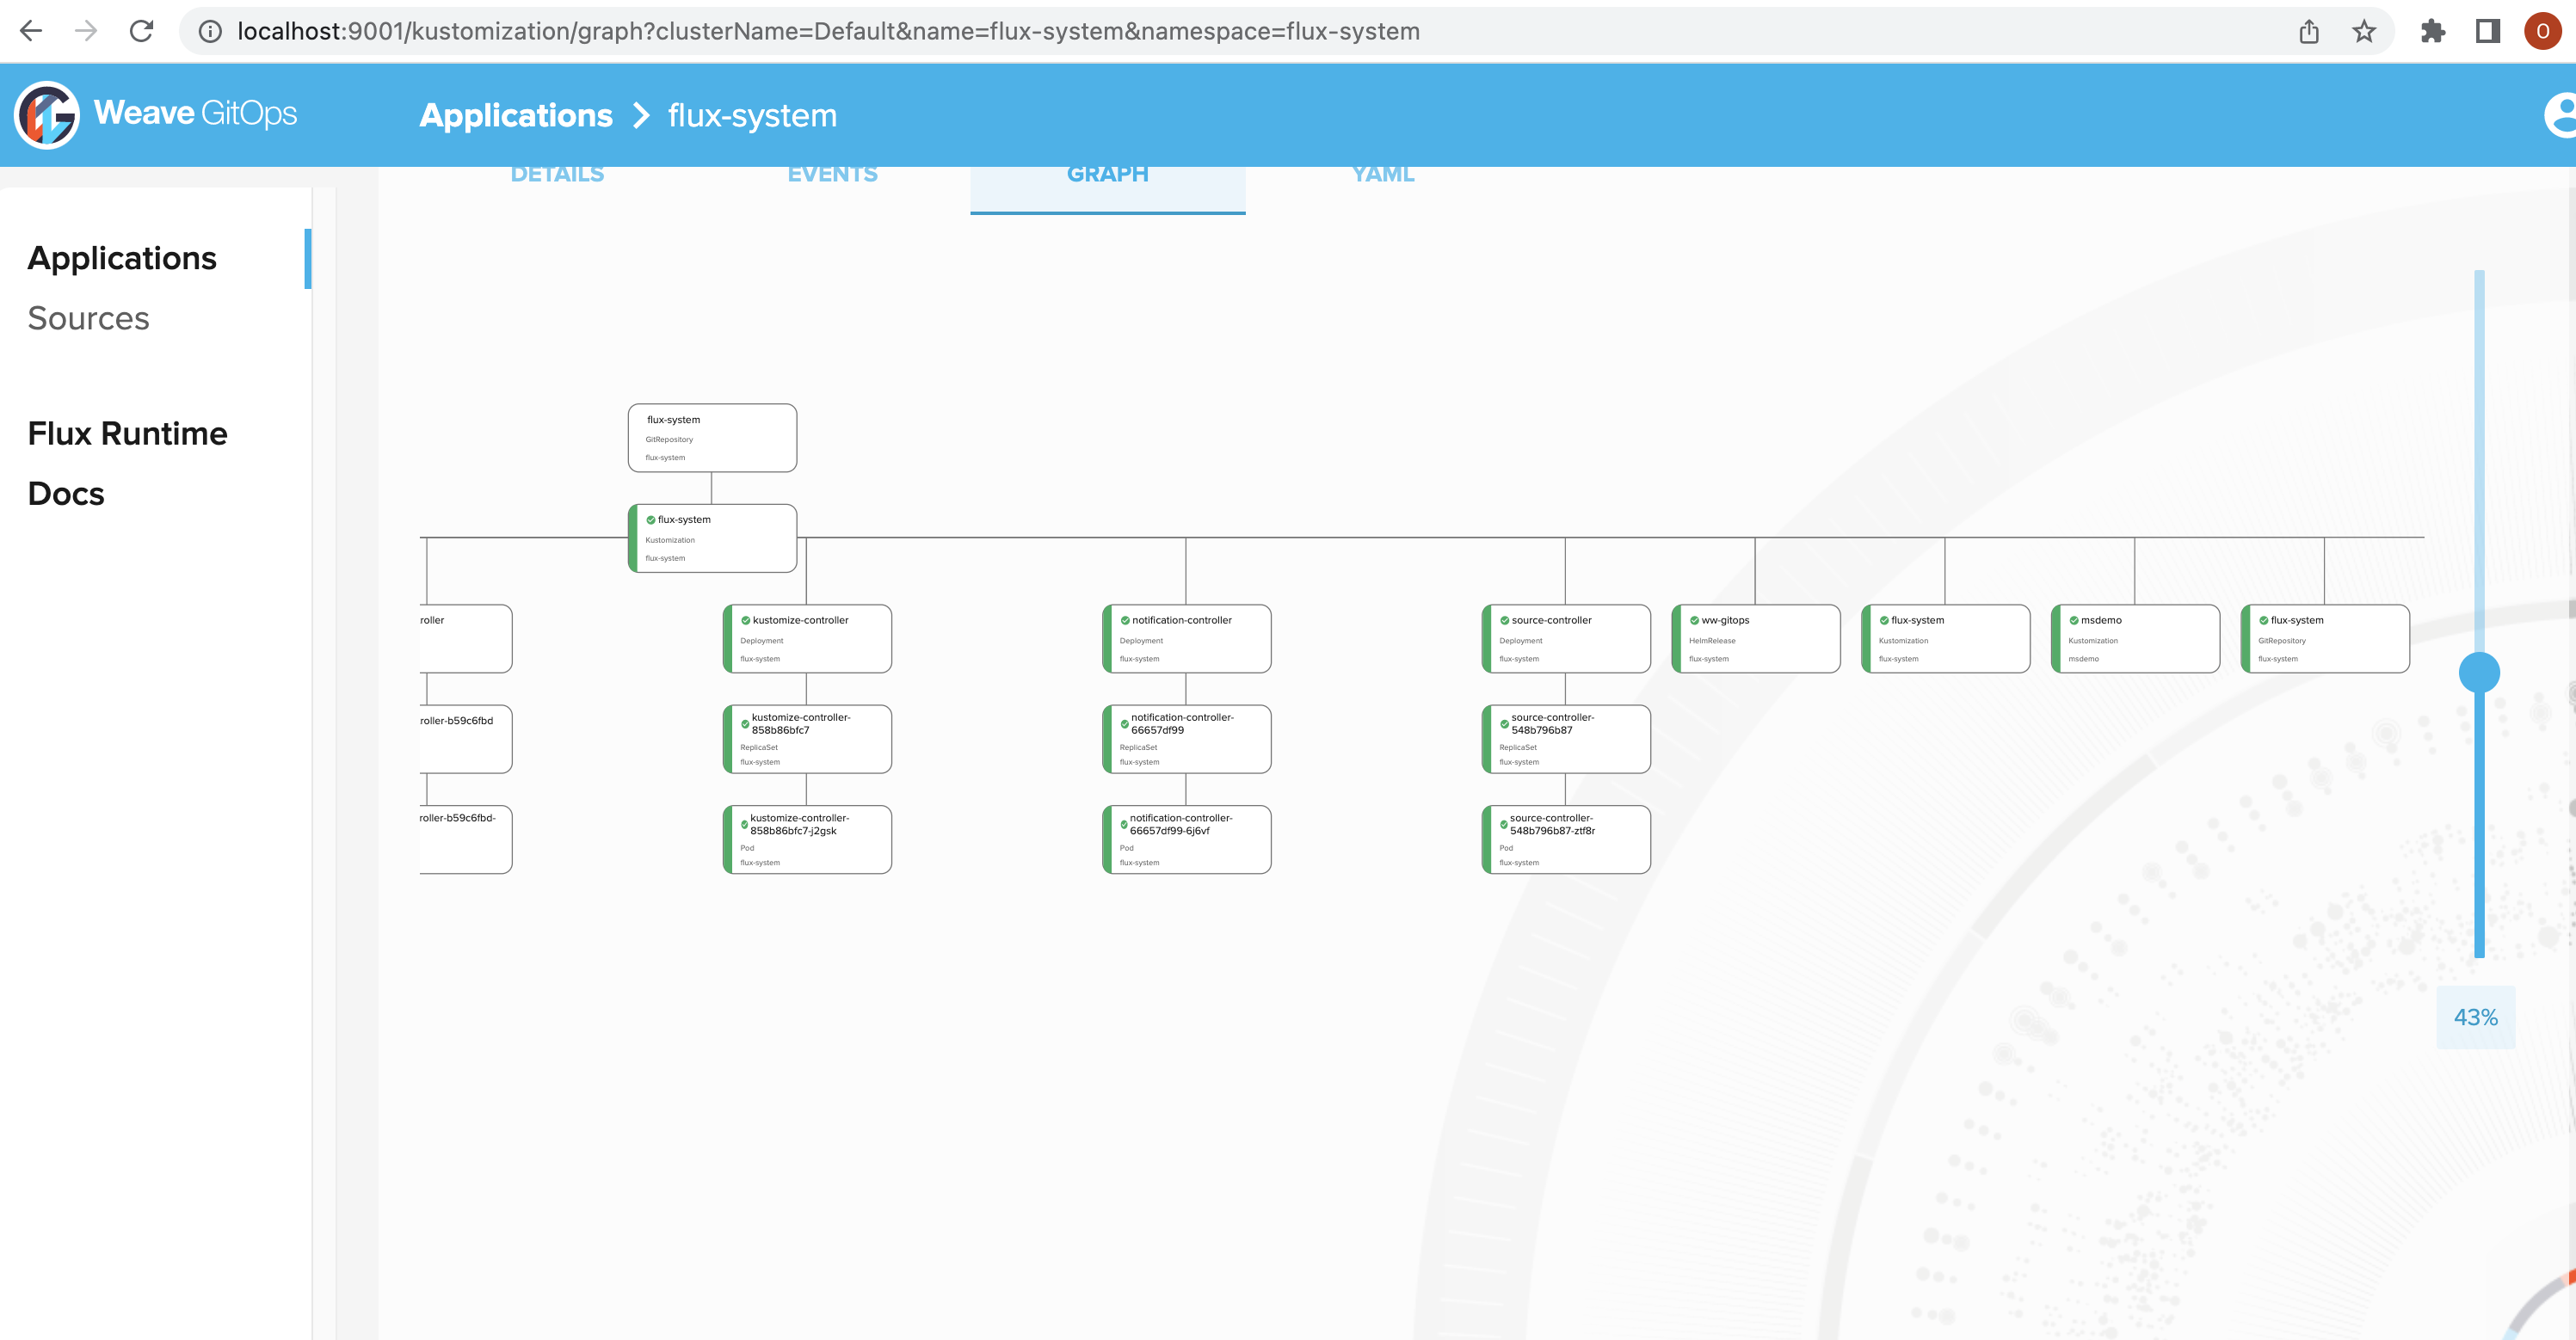
With the old lines you could clearly see that all top non-root nodes are connected to the root object. In the new version, they are connected to each other. Is it OK? |
Old:
New:
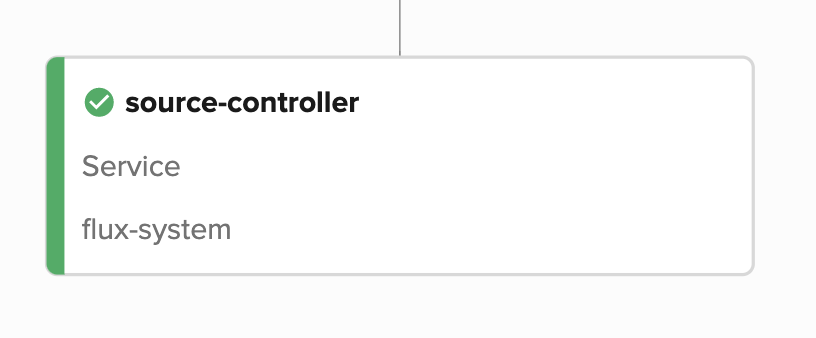
Besides, the green thing over the border looks a bit weird at large zoom: |
I wonder if we need to make the nodes wider and/or make more space for text? Maybe it all is not important to fix it all right now and I am nitpicking already. |
|
The intersection of the lines is fine with me. I don't like that top level non-root objects look like they are connected to each other (because the lines that connect each of these objects to the root object overlap). |
|
|
If we replace with (using only the second part without condition would work too, but I'm not sure if there could be any artifacts under some conditions)
The only issue left is that the nodes are not centered relative to the root node, but it is not related to making the lines diagonal. |
|
Looking carefully at #2484, that ticket describes a path that goes straight down, straight to the side, straight down again, whereas this PR only out and then down. So it's not quite the "right" shape (but then this branch doesn't promise to implement that shape).
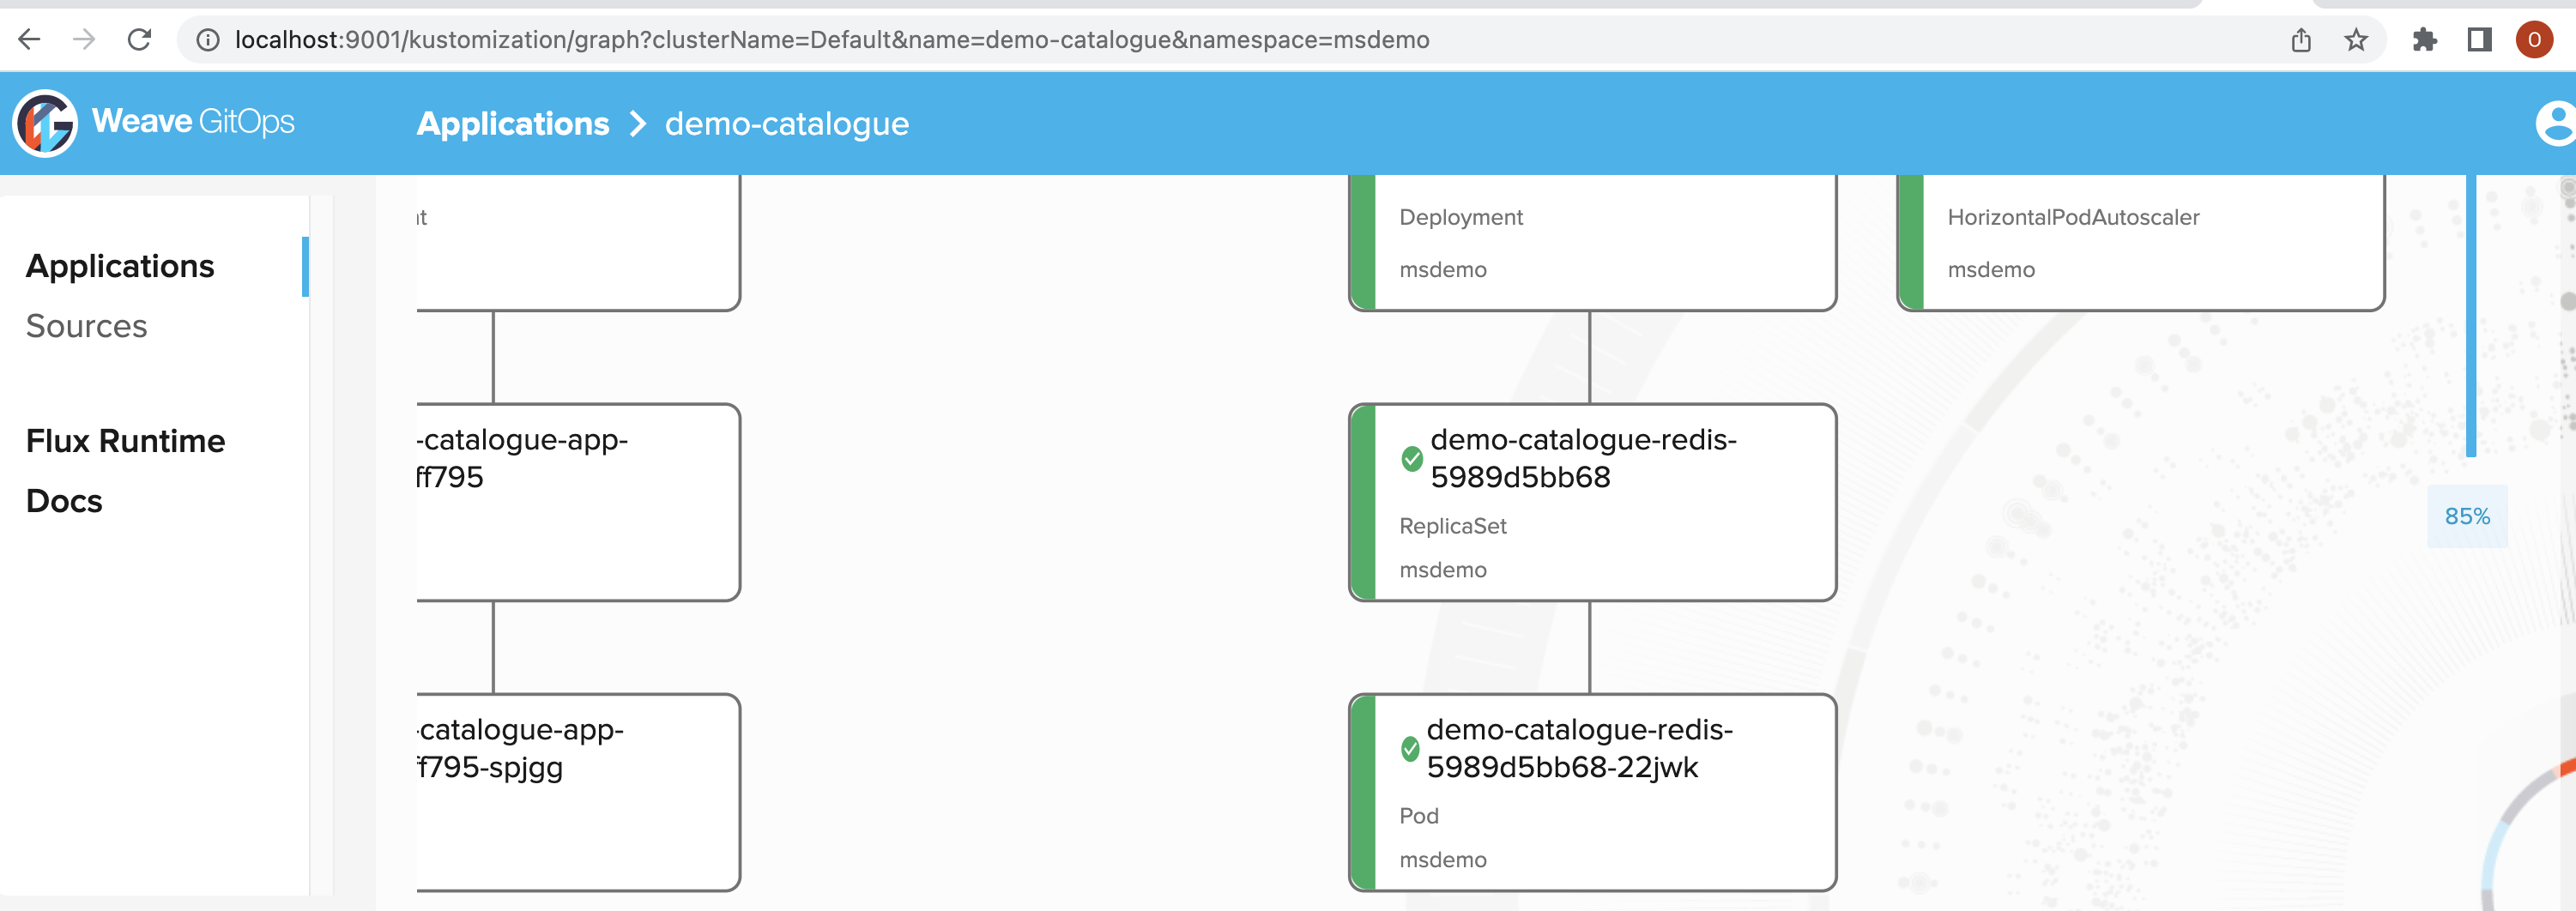
I think the issue here is that the boxes have irregular spacing. It looks like if the child node has children of its own (like helm-controller, kustomize-controller in @opudrovs's screenshot), then the gap before we draw the next child is 2 boxes' width, whereas if the child node has no children (like webhook-receiver) then the next node is drawn much closer. So in your screenshot, it's "centered" for an even number of boxes, but there's an empty box on the left side of the parent node. Do I make any sense? |
|
Great observations, @ozamosi ! |
…t direction and this is not a cry for help
…urn and then testing if it returns that is a little...I feel like it is useless but who am I to judge?"
… tree structure correctly
Closes #2437
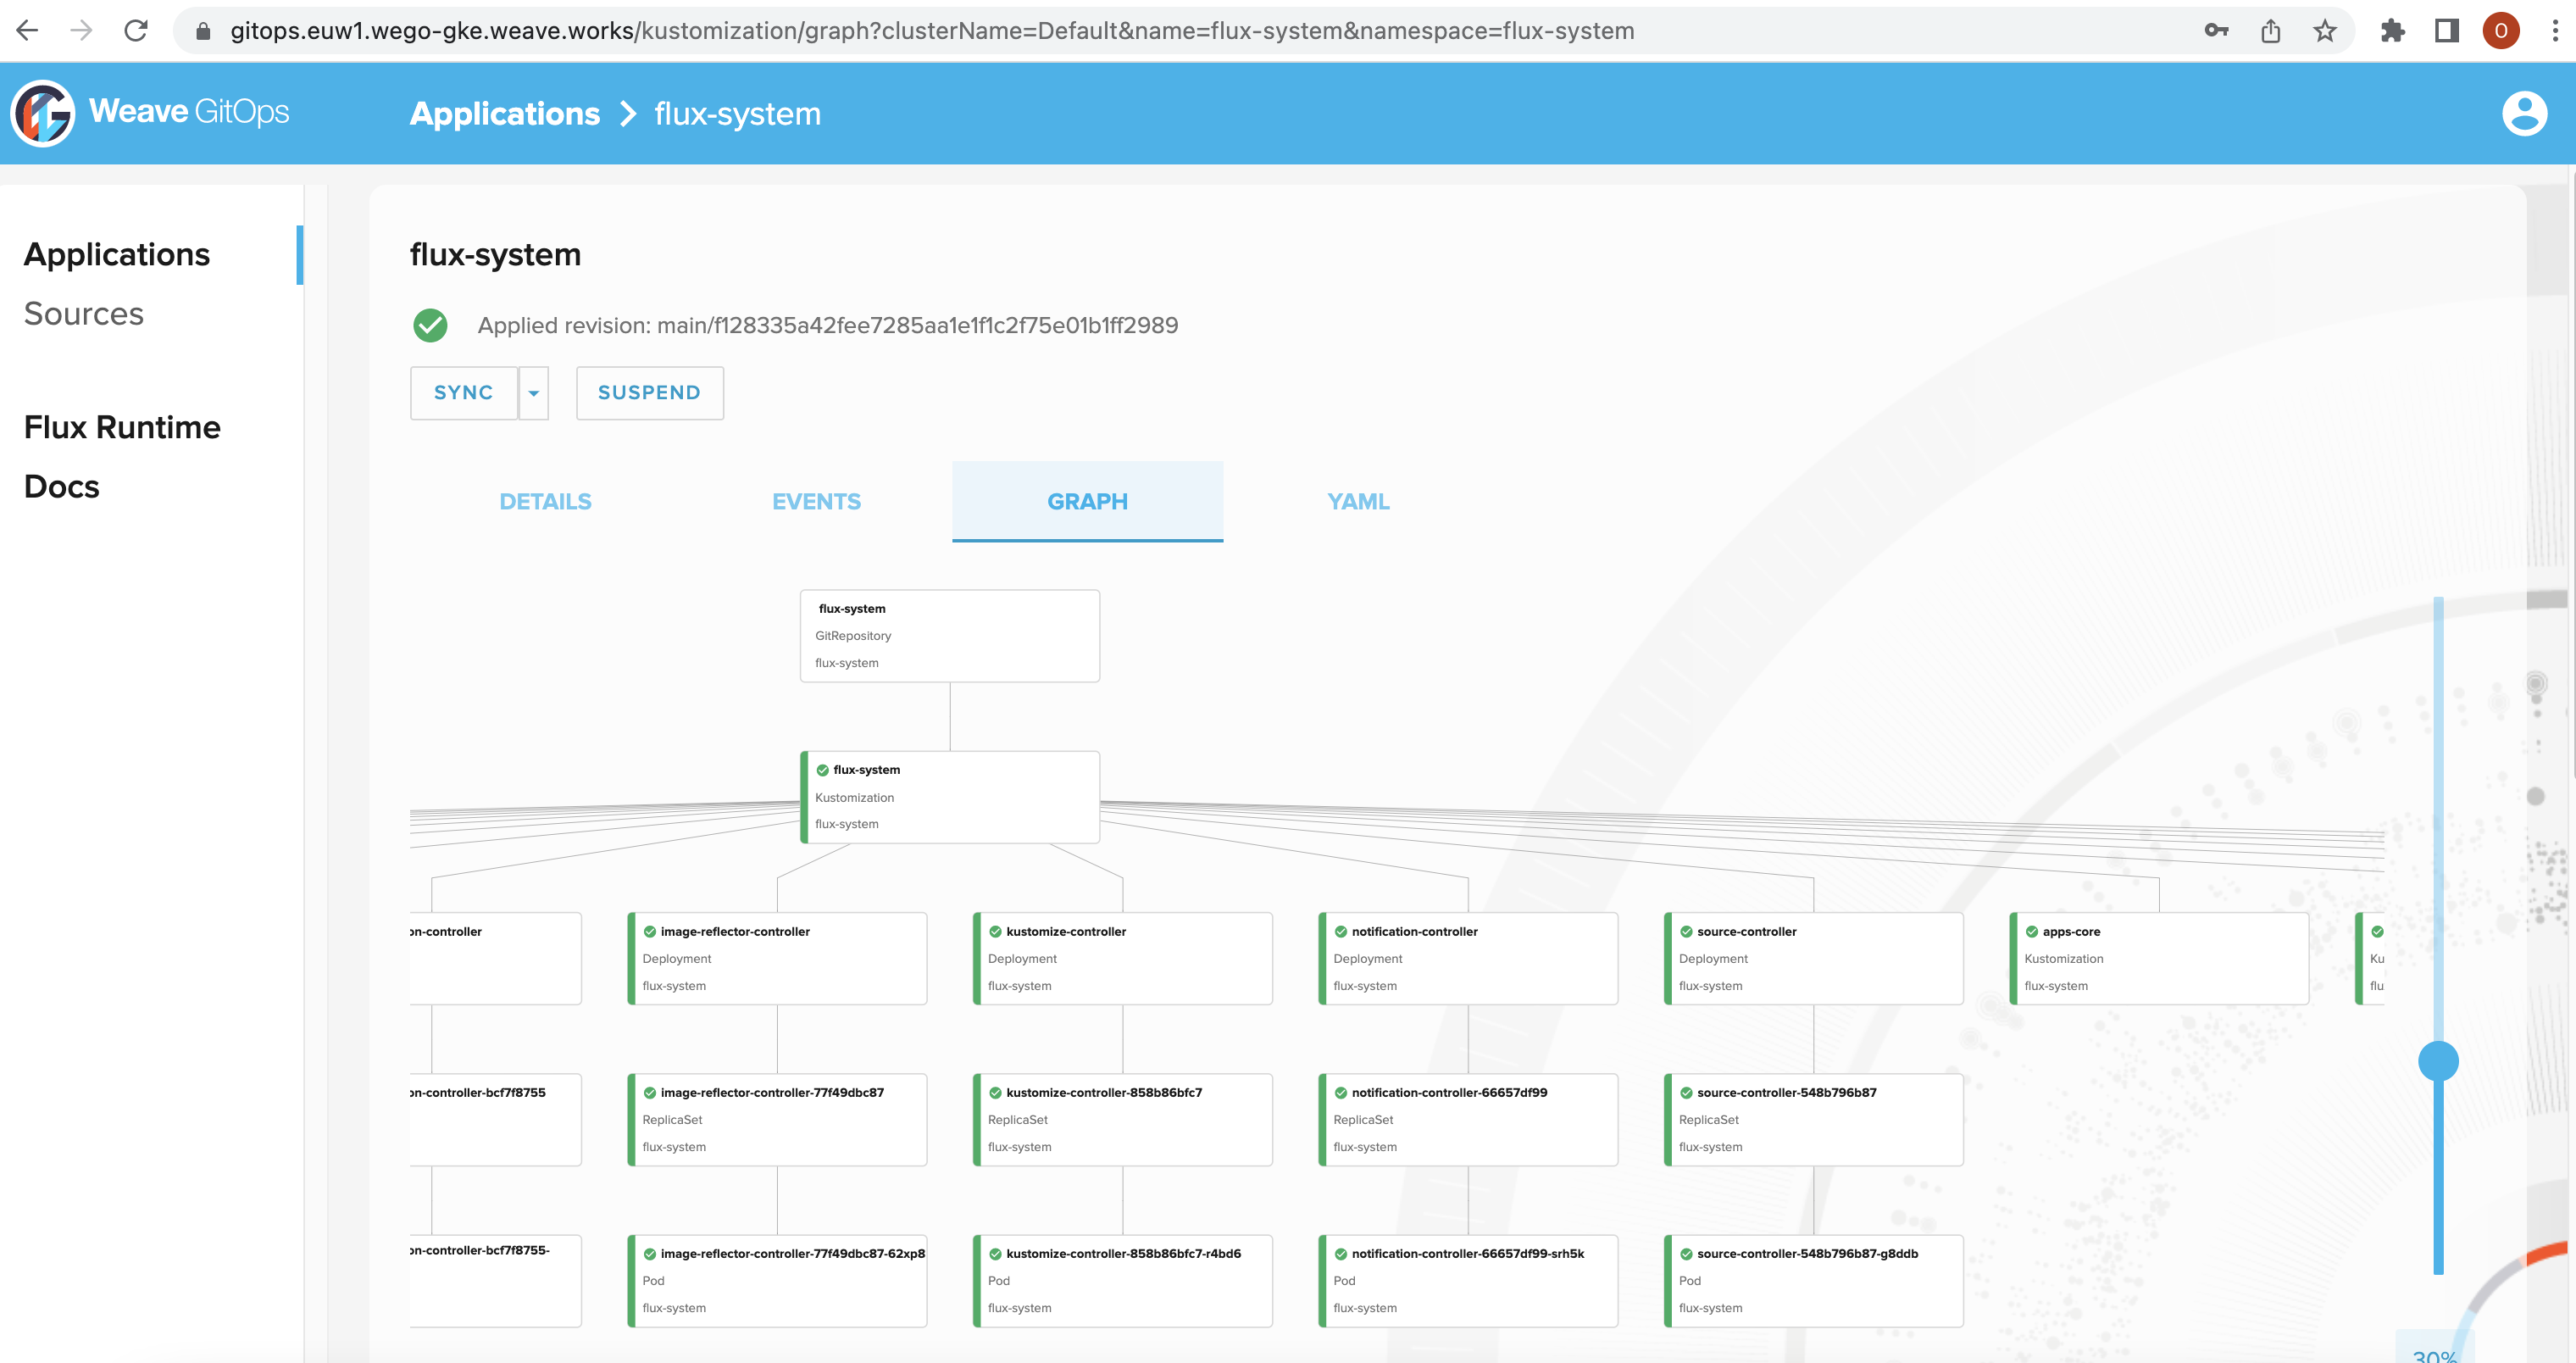
The main goal here was to remove the DagreD3 library and create the graph nodes and paths ourselves. This gives us a lot more flexibility with the graph code. Not only should it be a lot easier to change, but I think it's easier to understand as well (maybe that's just because I wrote it). I also separated out the actual JSX for the nodes for readability - no longer will you have to scroll through 200 lines of node styling to get to the graph code. I'm starting VERY simple here (although I'm definitely close to what we have right now), and the graph is now ready for any new features or redesigns we want to throw at it!
I also made a small change in the
computeReadyfunction to distinguish betweenReadyType.NotReadyandundefinedand followed up accordingly.How was this change implemented?
Some particulars:
Online videos recommended NOT using the
useRefhook and instead separating the data formation (ReconciliationGraph) and the rendering (DirectedGraph). We are now mapping out two arrays intog(group) elements - one of nodes (intoGraphNodes), and one of links (intopaths). We had to do a lot of code to get theforeignObjecttag into DagreD3, and now we just throw it into JSX! This also allowed me to move the node html to it's own component, which I'm really happy about.No more graph class - this is the only d3 code for the graph (FOR NOW):
The rest is made using svg html tags and their attributes in JSX.
This lets you pass down additional custom props to your styled components without Typescript complaining about it. Hooray!