


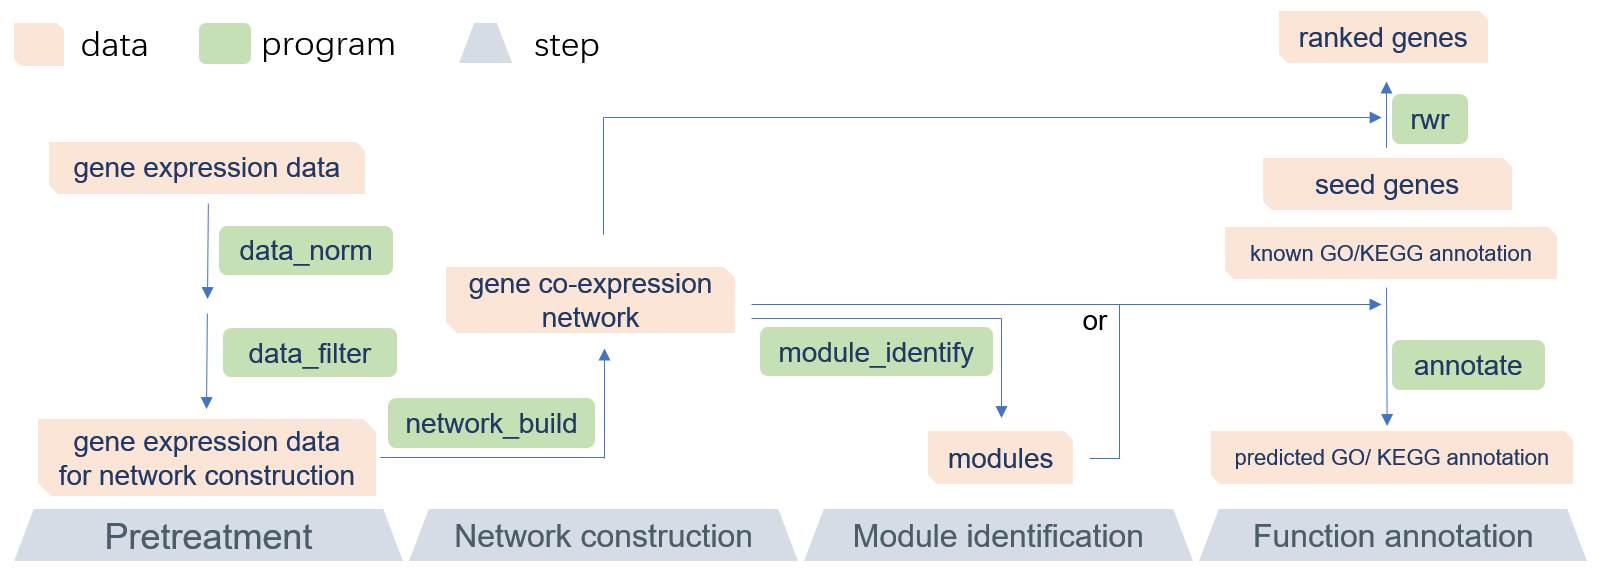
GCEN is a command-line toolkit that allows biologists to easily build gene co-expression network and predict gene function, especially in RNA-Seq research or lncRNA annotation. GCEN is primarily designed to be used in lncRNA annotation, but is not limited to those scenarios. It is an efficient and easy-to-use solution that will allow everyone to perform gene co-expression network analysis without sophisticated programming skills. The recommended pipeline consists of four parts: data pretreatment, network construction, module identification, and function annotation (Figure 1). A README file and sample data are included in the software package. Because of its modular design, the GCEN can be easily integrated into another pipeline. Also, the multithreaded implementation of GCEN makes it fast and efficient for RNA-Seq data.
 |
|---|
| Figure 1. The recommended pipeline of GCEN |
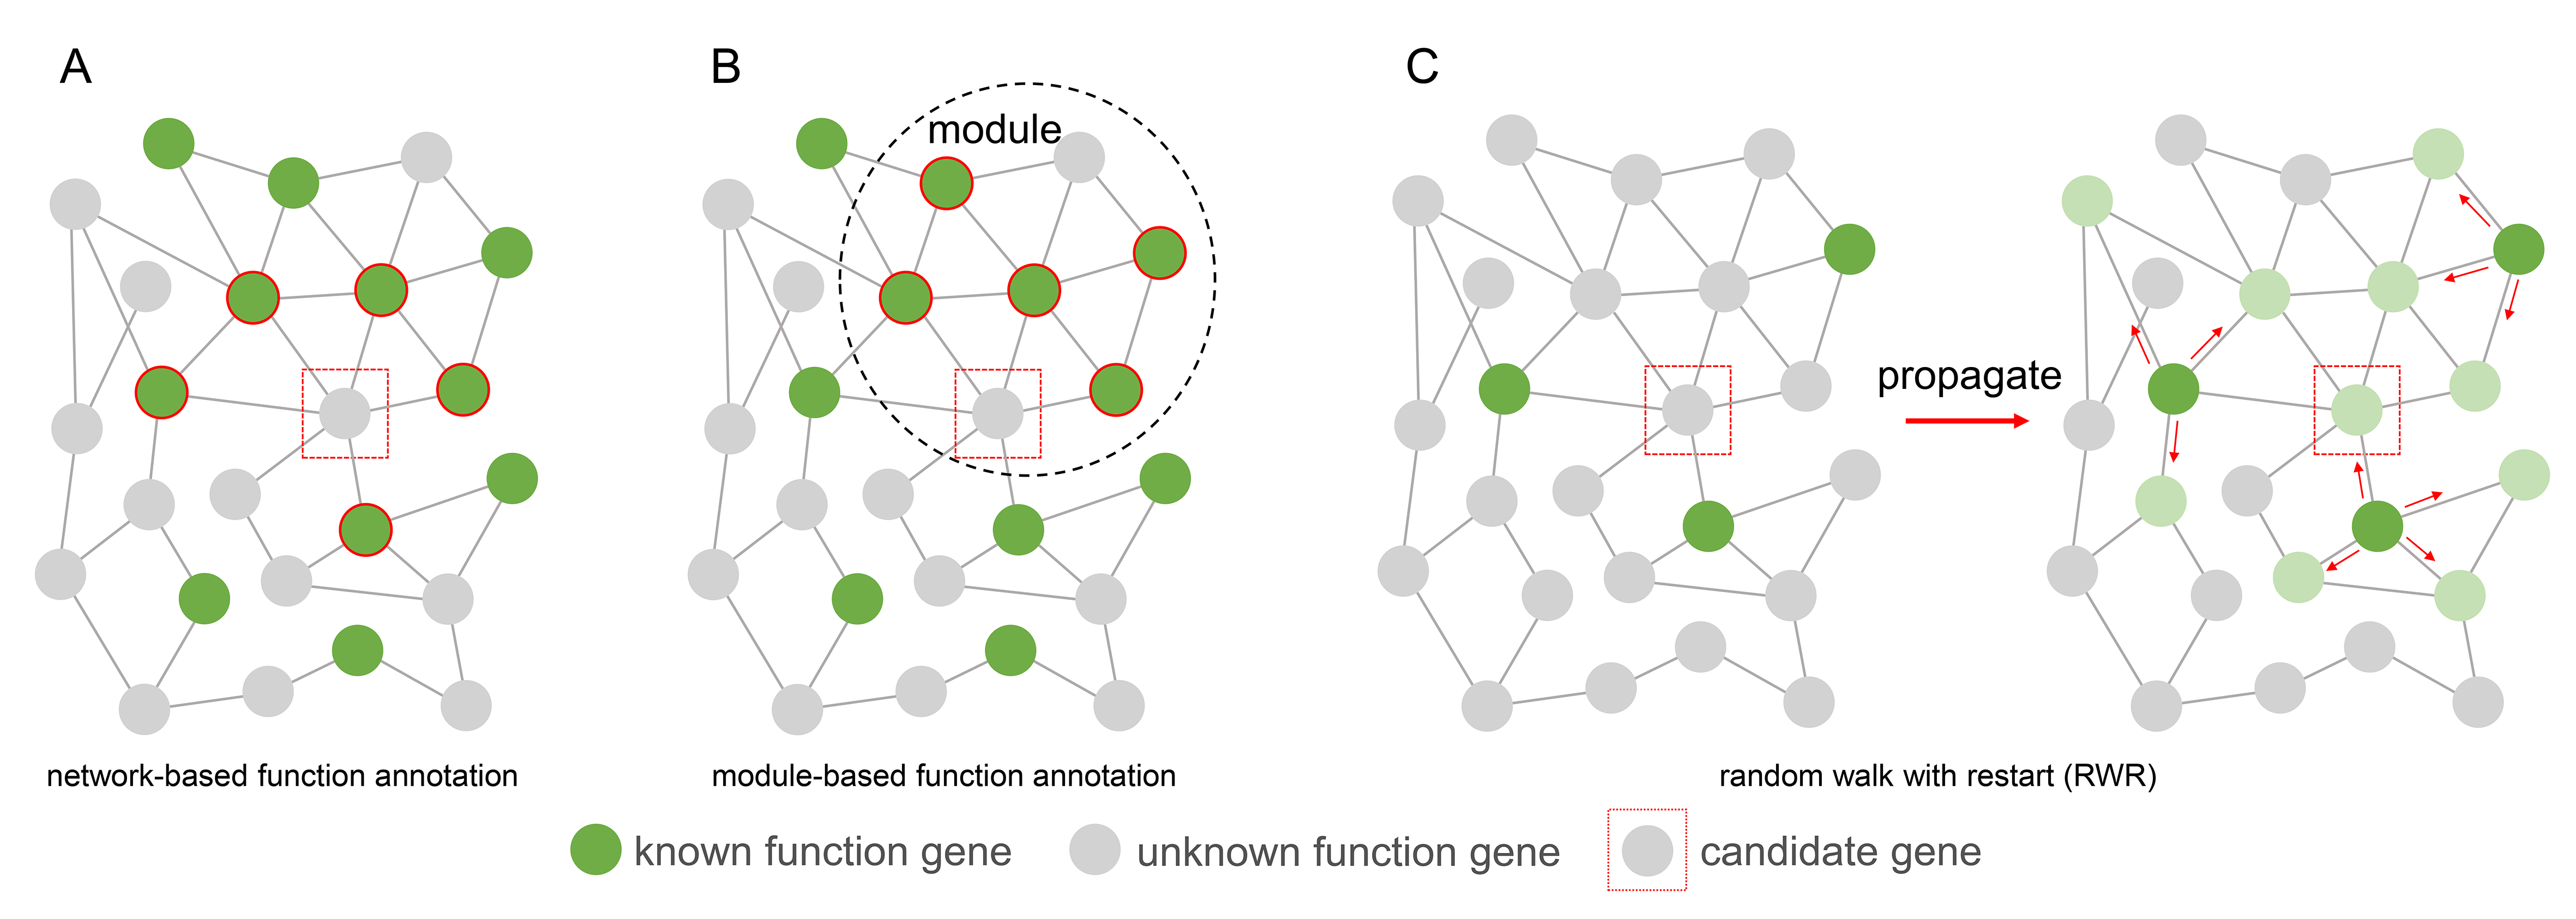
After gene co-expression network construction and module identification, we use gene function enrichment to predict novel lncRNAs or coding gene function. According to the Guilt-By-Association (GBA) principle, the function of an unknown gene was determined by the voting of its neighbor genes with known functions. These neighbor genes can be directly interacted genes in the network (Figure 2A), or they can be genes in the same module (Figure 2B). Another gene function analysis algorithm we implemented is the random walk with restart (RWR) (Figure 2C), which measures each node’s relevance with respect to given seed nodes (here are genes with known function annotations) based on network propagation. The information (known gene function) is propagated through the edges from seed nodes to nearby nodes until convergence. To the end, prior information associating genes with a function of interest is super imposed on the nodes of the network.
 |
|---|
| Figure 2. Gene function annotation methods |
- Easy to use, without writing any code
- High speed and low memory, can run on a personal computer
- Suitable for RNA-Seq analysis
GCEN is an open source software under the GPLv3 license. We provide source code and pre-built binaries. GCEN only supports 64-bit operating system and has been tested in Ubuntu 18.04 (Bionic Beaver), Ubuntu 20.04 (Focal Fossa), Windows 7, Windows 10, macOS 10.15 (Catalina) and macOS 11.0 (Big Sur).
gcen-0.6.3-linux-x86_64.tar.gz
gcen-0.6.3-macOS-x86_64.tar.gz
For Linux and macOS user, you can install GCEN with conda. Since bioconda does not support Windows, Windows users can download the pre-built binaries directly from our website.
conda install gcen -c bioconda
mkdir -p ~/software/
cd ~/software/
wget https://www.biochen.org/gcen/static/0.6.3/gcen-0.6.3-linux-x86_64.tar.gz
tar zxf gcen-0.6.3-linux-x86_64.tar.gz
echo "export PATH=$HOME/software/gcen-0.6.3-linux-x86_64/bin:\$PATH" >> ~/.bashrc
echo "export PATH=$HOME/software/gcen-0.6.3-linux-x86_64/util:\$PATH" >> ~/.bashrc
source ~/.bashrc
rm ~/software/gcen-0.6.3-linux-x86_64.tar.gzStep 0: enter the bin directory of GCEN
The executable program is located in the bin directory and the sample data is located in the sample_data directory. All of the following commands can be run with the sample data. We first switch the current directory to the bin directory.cd ~/software/gcen-0.6.3-linux-x86_64/bin/
Step 1: data pretreatment
./data_norm -i ../sample_data/gene_expr.tsv -o ../sample_data/gene_expr_norm.tsv -m tmm
./data_filter -i ../sample_data/gene_expr_norm.tsv -o ../sample_data/gene_expr_norm_filter.tsv -p 0.75
Step 2: co-expression network construction
./network_build -i ../sample_data/gene_expr_norm_filter.tsv -o ../sample_data/gene_co_expr.network -m spearman -p 0.001 -c 0.8 -f -t 6
Step 3: module identification (optional)
./module_identify -i ../sample_data/gene_co_expr.network -o ../sample_data/module.txt -s 0.5 -t 6
Step 4: function annotation
# network based annotation
./annotate -g ../sample_data/go-basic.obo -a ../sample_data/gene_go.assoc -n ../sample_data/gene_co_expr.network -o ../sample_data/network_go_annotation
./annotate -k ../sample_data/K2ko.tsv -a ../sample_data/gene_kegg.assoc -n ../sample_data/gene_co_expr.network -o ../sample_data/network_kegg_annotation

# module based annotation (optional)
./annotate -g ../sample_data/go-basic.obo -a ../sample_data/gene_go.assoc -m ../sample_data/module.txt -o ../sample_data/module_go_annotation
./annotate -k ../sample_data/K2ko.tsv -a ../sample_data/gene_kegg.assoc -m ../sample_data/module.txt -o ../sample_data/module_kegg_annotation

# identify genes with specific functions based on RWR (optional)
./rwr -n ../sample_data/gene_co_expr.network -g ../sample_data/rwr_interested_gene.list -o ../sample_data/rwr_result.tsv
data_norm
description:
  The program data_norm normalizes the gene expression data.
usage:
  data_norm -i input_file -o output_file -m normalization_method
options:
  -i --input <input file>
  -o --output <output file>
  -m --method <upqt | median | deseq | tmm | hkg> normalization method (default: upqt)
  -g --gene <housekeeping gene list>  only for '--method hkg'
  -v --version display GCEN version
  -h --help print help information
example:
  data_norm -i ../sample_data/gene_expr.tsv -o ../sample_data/gene_expr_norm.tsv -m tmm
data_filter
description:
  The program data_filter filters genes according to the their expression mean and standard deviation.
usage:
  data_filter -i input_file -o output_file
options:
  -i --input <input file>
  -o --output <output file>
  -c --cutoff_mean <number> mean cutoff of gene expression (default: 0.0)
  -C --cutoff_sd <number> standard deviation cutoff of gene expression (default: 0.0)
  -p --percent_mean <number> keep a proportion of total genes based mean of gene expression (default: 1.0)
  -P --percent_sd <number> keep a proportion of total genes based standard deviation of gene expression (default: 1.0)
  -v --version display GCEN version
  -h --help print help information
example:
  data_filter -i ../sample_data/gene_expr.tsv -o ../sample_data/gene_expr_filter.tsv -p 0.75
network_build
description:
  The program network_build constructs gene co-expression network using gene expression matrix.
usage:
  network_build -i gene_expr.tsv -o gene_co_expr.network
options:
  -i --input <input file>
  -o --output <output file>
  -m --method <pearson or spearman> correlation coefficient method (default: spearman)
  -l --log <log | log2 | log10> make a log(x+1) transformation (default: not transform)
  -t --thread <number> cpu cores (default: 2)
  -p --pval <number> p value cutoff (default: 0.001)
  -c --cor <number> correlation coefficient cutoff (default: 0.1)
  -s --signed singed network (default: unsinged)
  -f --fdr calculate FDR (default: not calculated)
  -a --all output all edges without any cutoff (if -a is specified, the -p and -c are ignored)
  -v --version display GCEN version
  -h --help print help information
example:
  network_build -i ../sample_data/gene_expr_norm_filter.tsv -o ../sample_data/gene_co_expr.network -m spearman -p 0.001 -c 0.8 -f
module_identify
description:
  The program module_identify identifies the gene modules using the gene co-expression network.
usage:
  module_identify -i input_file -o output_file
options:
  -i --input <input file>
  -o --output <output file>
  -s --similarity <number> similarity cutoff (default: 0.5)
  -t --thread <number> cpu cores (default: 2)
  -v --version display GCEN version
  -h --help print help information
example:
  module_identify -i ../sample_data/gene_co_expr.network -o ../sample_data/module.txt
annotate
description:
  The program annotate can perform GO/KEGG annotation based on network or module.
usage:
  annotate -g go-basic.obo -a gene_go_association_file -n input_network -o out_dir
options:
  -g --go <go-basic.obo file>
  -k --kegg <kegg information> (if the -g/--go is specified, the -k/--kegg are ignored)
  -a --assoc <gene-GO/KEGG association file>
  -n --network <network file>
  -m --module <module file> (if -n is specified, the -m is ignored)
  -p --pval <number> p value cutoff (default: 0.05)
  -o --output <output directory>
  -t --thread <number> cpu cores (default: 2)
  -v --version display GCEN version
  -h --help print help information
examples:
  ./annotate -g ../sample_data/go-basic.obo -a ../sample_data/gene_go.assoc -n ../sample_data/gene_co_expr.network -o ../sample_data/network_go_annotation
  ./annotate -g ../sample_data/go-basic.obo -a ../sample_data/gene_go.assoc -m ../sample_data/module.txt -o ../sample_data/module_go_annotation
  ./annotate -k ../sample_data/K2ko.tsv -a ../sample_data/gene_kegg.assoc -n ../sample_data/gene_co_expr.network -o ../sample_data/network_kegg_annotation
  ./annotate -k ../sample_data/K2ko.tsv -a ../sample_data/gene_kegg.assoc -m ./sample_data/module.txt -o ../sample_data/module_kegg_annotation
rwr
description:
  The program rwr can predict potential funcation associated genes based on RWR (Random Walk with Restart) algorithm.
usage:
  rwr -n input_network -g gene_list -o output_result
options:
  -n --network <network file>
  -g --gene <seed genes list file>
  -r --gamma <number> restart probability (default: 0.5)
  -p --prob <number> probability cutoff (defalut: 0.01)
  -o --output <output file>
  -d --directed_network the input network is directed (defalut: the input network is undirected)
  -w --weighted_network the edge weights of network will be considered (defalut: all edge weights of network are set to 1.0)
  -W --weighted_gene the weights of seed genes will be considered (defalut: all weights of seed genes are set to 1.0)
  -v --version display GCEN version
  -h --help print help information
example:
  rwr -n ../sample_data/gene_co_expr.network -g ../sample_data/rwr_seed_genes.list -o ../sample_data/rwr_ranked_gene.tsv
csv_to_tsv
description:
  The program csv_to_tsv converts CSV file into TSV file.
usage:
  csv_to_tsv -i input.csv -o output.tsv
options:
  -i --input <input csv file>
  -o --output <output tsv file>
  -v --version display GCEN version
  -h --help print help information
example:
  csv_to_tsv -i ../sample_data/gene_expr.csv -o ../sample_data/gene_expr.tsv
tsv_to_csv
description:
  The program csv_to_tsv converts TSV file into CSV file.
usage:
  tsv_to_csv -i input.tsv -o output.csv
options:
  -i --input <input tsv file>
  -o --output <output csv file>
  -v --version display GCEN version
  -h --help print help information
example:
  tsv_to_csv -i ../sample_data/gene_expr.tsv -o ../sample_data/gene_expr.csv
data_stat
description:
  The program data_stat calculates the statistics of gene expression matrix.
usage:
  data_stat -i input_file
options:
  -i --input <input file>
  -v --version display GCEN version
  -h --help print help information
example:
  data_stat -i ../sample_data/gene_expr.tsv
network_stat
description:
  The program network_stat calculates the statistics of network.
usage:
  network_stat -i input_file
options:
  -i --input <input file>
  -v --version display GCEN version
  -h --help print help information
example:
  network_stat -i ../sample_data/gene_co_expr.network
network_merge
description:
  The program network_merge merges two or more networks.
usage:
  network_merge -i input_files -o output_file
options:
  -i --input <input files> multiple files are separated by commas
  -o --output <output file>
  -c --cor <number> correlation coefficient cutoff (default: 0.5)
  -h --help print help information
example:
  network_merge -i ../sample_data/test_1.network,../sample_data/test_2.network -o ../sample_data/test_merge.network
network_extract
description:
  The program network_extract extracts subnetwork based on a gene list.
usage:
  network_extract -i input.network -g gene_list.txt -o output.network
options:
  -i --input <input network file>
  -o --output <output network file>
  -g --gene <gene list file>
  -v --version display GCEN version
  -h --help print help information
example:
  network_extract -i ../sample_data/gene_co_expr.network -g ../sample_data/gene_list.txt -o ../sample_data/sub.network
network_shuffle
description:
  The program network_shuffle random shuffles network with degree preserving.
usage:
  network_shuffle -i input.network -o output.network
options:
  -i --input <input network file>
  -o --output <output network file>
  -s --swap <number> multiples of edges number for double-edge swaps to perform (default 100)
  -v --version display GCEN version
  -h --help print help information
example:
  network_shuffle -i ../sample_data/test_1.network -o ../sample_data/random_shuffled.network
calculate_accuracy
description:
  The program calculate_accuracy calculate the accuracy of prediction.
usage:
  calculate_accuracy -g go-basic.obo -a gene_go_association_file -n input_network
options:
  -g --go <go-basic.obo file>
  -a --assoc <gene-GO/KEGG association file>
  -n --network <network file>
  -p --pval <number> p value cutoff (default: 0.05)
  -t --thread <number> cpu cores (default: 2)
  -v --version display GCEN version
  -h --help print help information
examples:
  ./calculate_accuracy -g ../sample_data/go-basic.obo -a ../sample_data/gene_go.assoc -n ../sample_data/gene_co_expr.network
enrich
description:
  The program enrich can perform GO/KEGG enrichment.
usage:
  enrich -e enrichment_gene_list_file -b background_gene_list_file -g go-basic.obo -a gene_go_association_file -p p_value_cutoff -o out_put_file
options:
  -e --enrich <enrichment gene list file>
  -b --background <background gene list file>
  -g --go <go-basic.obo file>
  -k --kegg <kegg information> (if the -g/--go is specified, the -k/--kegg are ignored)
  -a --assoc <gene/go association file>
  -p --pval <number> p value cutoff (default: 0.05)
  -o --output <output file>
  -v --version display GCEN version
  -h --help print help information
examples:
  enrich -e ../sample_data/enrichment_gene.list -b ../sample_data/background_gene.list -g ../sample_data/go-basic.obo -a ../sample_data/gene_go.assoc -p 0.05 -o ../sample_data/enrichment.go
  enrich -e ../sample_data/enrichment_gene.list -b ../sample_data/background_gene.list -k ../sample_data/K2ko.tsv -a ../sample_data/gene_kegg.assoc -p 0.05 -o ../sample_data/enrichment.kegg
generate_expr_matrix_from_rsem
description:
  The program generate_expr_matrix_from_rsem generates gene expression matrix from RSEM outputs.
usage:
  generate_expr_matrix_from_rsem -i input_file -o output_file
options:
  -i --input <input file> a text file with sample ID and path to its RSEM result file on each line
  -o --output <output file>
  -t --tpm output TPM value instead of FPKM vaule
  -v --version display GCEN version
  -h --help print help information
example:
  generate_expr_matrix_from_rsem -i ../sample_data/rsem/rsem_sample.txt -o ../sample_data/rsem/rsem_gene_expr.tsv
generate_expr_matrix_from_stringtie
description:
  The program generate_expr_matrix_from_stringtie generates gene expression matrix from StringTie outputs.
usage:
  generate_expr_matrix_from_stringtie -i input_file -o output_file
options:
  -i --input <input file> a text file with sample ID and path to its GTF file on each line
  -o --output <output file>
  -t --tpm output TMP value instead of FPKM vaule
  -v --version display GCEN version
  -h --help print help information
example:
  generate_expr_matrix_from_stringtie -i ../sample_data/stringtie/stringtie_sample.txt -o ../sample_data/stringtie/stringtie_gene_expr.tsv
To understand the format of the input and output files for each program, please take a look at the sample data included in the software package.
Most input and output files of GCEN are tab-separated values (TSV) files. We provide two programs csv_to_tsv and tsv_to_csv for converting TSV and CSV files to each other.
Formats of some critical files are described as follows:
Gene expression matrix
The first column are gene name, the others are gene expression value.#gene SRR372787 SRR372788 SRR372789 SRR372790 SRR372791 SRR372792
ENSDARG00000117464 0.00 55.64 8.33 219.56 0.00 249.22
ENSDARG00000117133 0.00 21.20 0.00 18.15 0.00 29.70
ENSDARG00000117089 62.73 55.50 318.04 240.76 96.14 69.75
ENSDARG00000116743 18.43 219.98 6.71 189.01 11.30 221.65
ENSDARG00000115987 0.00 92.30 0.00 78.53 24.40 108.66
Gene co-expressiong network
Each column is gene a, gene b, correlation coefficent, p-value, FDR.#node1 node2 correlation p-value FDR
ENSDARG00000039935 ENSDARG00000062108 0.881139 2.988639e-06 8.097798e-05
ENSDARG00000039935 ENSDARG00000016088 0.867002 6.652075e-06 1.420293e-04
ENSDARG00000039935 ENSDARG00000099024 0.823607 4.842646e-05 5.762282e-04
ENSDARG00000039935 ENSDARG00000001803 0.805322 9.588506e-05 9.389785e-04
ENSDARG00000039935 ENSDARG00000019835 0.885008 2.359077e-06 6.912051e-05
Known gene annotation
The first column are genename, the others are annotation. For genes with multiple annotations, a format with multiple rows (two columns per row, for gene and annotation) per gene is also acceptable.ENSG00000211780 GO:0005886
ENSG00000211780 GO:0002250
ENSG00000211664 GO:0002377 GO:0005886 GO:0006955 GO:0005615 GO:0003823 GO:0002250
ENSG00000231292 GO:0002377 GO:0005615 GO:0006955
ENSG00000271383 GO:0005737
Predicted gene GO annotation
GO	name	name_space	enrichment	study_count	study_n	pop_count	pop_n	p_val
GO:0035672	oligopeptide transmembrane transport	biological_process	e	3	49	3	973	0.000120375
GO:0006857	oligopeptide transport	biological_process	e	3	49	3	973	0.000120375
GO:0044281	small molecule metabolic process	biological_process	e	12	49	91	973	0.00109452
GO:0006766	vitamin metabolic process	biological_process	e	3	49	5	973	0.00111971
GO:0006446	regulation of translational initiation	biological_process	e	3	49	5	973	0.00111971
Predicted gene KEGG annotation
The first column are gene name, the others are gene expression value.ko name enrichment study_count study_n pop_count pop_n p_val
ko02010 ABC transporters e 4 50 7 443 0.00391765
ko04070 Phosphatidylinositol signaling system e 2 50 3 443 0.0348134
ko04011 MAPK signaling pathway - yeast e 2 50 3 443 0.0348134
ko04977 Vitamin digestion and absorption e 2 50 3 443 0.0348134
ko00520 Amino sugar and nucleotide sugar metabolism e 2 50 3 443 0.0348134
Wen Chen, Jing Li, Shulan Huang, Xiaodeng Li, Xuan Zhan, Xiang Hu, Shuanglin Xiang, Changning Liu. GCEN: An Easy-to-Use Toolkit for Gene Co-Expression Network Analysis and lncRNAs Annotation. Current Issues in Molecular Biology 2022; 44(4): 1479-1487. doi:10.3390/cimb44040100
We appreciate your interest in our work. For further information or if you have any questions, please do not hesitate to contact us (Wen Harold Chen, chenwen@biochen.org).