Skip to content
New issue

Have a question about this project? Sign up for a free GitHub account to open an issue and contact its maintainers and the community.

By clicking “Sign up for GitHub”, you agree to our terms of service and privacy statement. We’ll occasionally send you account related emails.

Already on GitHub? Sign in to your account

High CPU usage. #135

Closed
chmol opened this issue Nov 1, 2016 · 23 comments
Closed

High CPU usage. #135

chmol opened this issue Nov 1, 2016 · 23 comments

Comments

@chmol
Copy link

chmol commented Nov 1, 2016

Hi,

I started using the app yesterday and noticed a really high cpu usage with the 2.11.2666 build on arch linux. This issue might be linked with the macOS battery ones : #122

nov01-13 32 46

@markjes
Copy link

markjes commented Nov 1, 2016

Same here on 2.11.2666.
screenshot_2016-11-01_17-53-22
screenshot_2016-11-01_17-53-54

@herrmannplatz
Copy link
Contributor

Thanks for the help. So this was when the app was idling. Or was it doing anything specific. Running a call, displaying a gif or processing incoming messages?

@markjes
Copy link

markjes commented Nov 2, 2016

When i start the app is taking a lot of ram and cpu and after that displaying a gif.

@chmol
Copy link
Author

chmol commented Nov 3, 2016

I checked again, it's on idle but gif are present in the conversations.
If I close the window, the app is still running in background ( i think) the usage goes to less than 5 percent.

Hope it helps.

@DCxDemo
Copy link

DCxDemo commented Nov 16, 2016

is 7-10% cpu load during a call on i7-2600 considered normal?

@lunarthegrey
Copy link

I have noticed high CPU usage on Ubuntu 14.04. I was doing a video call and it was using nearly 50% of my CPU.

@nfind
Copy link

nfind commented Dec 7, 2016

Hi!
I also noticed a "high" CPU usage in idle of Wire, approximate 16-18%. I use Mac OS X 10.11.6 and here it is not the process of the Wire.app itself, the load is produced by a separate process called "Wire helper". What does this extra process in the background, constantly?

@nfind
Copy link

nfind commented Dec 17, 2016

Update: Suddenly the process "Wire helper" stops to "eat up" the CPU…

@maximbaz
Copy link
Contributor

I also see Wire using ~15% CPU when it is idling. However this bug reproduces only when certain conversations are open. In other words, select one conversation, switch to another app and do something else for a minute, then observe the CPU usage of Wire process and notice that it is constantly ~15%. Select another conversation, do something else for a minute and observe 0% CPU usage of Wire process.

I don't see any obvious connection between the conversations that do and don't produce high CPU usage:

  • it's not a matter of having gifs (I have one conversation where the CPU usage is high and yet there are no gifs)
  • it's not a matter of total history size (I have one conversation with definitely a large history, and yet the bug does not reproduce for it).

And as someone else pointed out, close Wire window and CPU usage drops to 0%, for any conversation.

@nfind
Copy link

nfind commented Jan 10, 2017

Yeah, I have to revise my last post. It started again using constantly about 15% CPU usage. But as I got no feedback, I switched now to an app called Franz. Which can handle a lot more messengers and with no uncertain CPU usage.

@maximbaz
Copy link
Contributor

@nfind you may want to monitor your CPU usage further, I don't think using Franz will solve the issue. In fact I don't think this is a wire-desktop issue at all, I think it belongs to wire-webapp, and so whatever client you use (let it be wire-desktop, Franz or a browser) you will experience this issue. Maybe just like in my case, depending on which conversation is opened the bug is or is not reproducible for you, or maybe there is some other condition.

I can actually reproduce this in Google Chrome.

I think this is a severe issue, I was wondering lately why the battery on my laptop degraded so quickly, until I stumbled on this bug. I can say now that it is true, my battery lives considerably longer with having Wire window closed.

@herrmannplatz
Copy link
Contributor

herrmannplatz commented Jan 11, 2017

First thanks for all the input and comment. I finally had some time to debug. There are several issues that (might) cause this:

Reworking the image loading a bit, so i will try to knock down these issue.

@geigi
Copy link

geigi commented Jan 30, 2017

Awesome that you may found some things that could cause this issue!

Some observations from me, running 10.12.3 with Wire 2.11.2686:
When I open a conversation Wire Helper consumes about 10-15% CPU in idle, it doesn't matter whether Wire is freshly opened or not. But when I hide Wire with CMD + H the CPU usage drops to 0% immediately.

Another observation: The bigger the wire window the higher the CPU usage is for me. On a 1080p screen with a maximised Wire window it stays at around 20-25%.

@anatoli26
Copy link

anatoli26 commented Feb 19, 2017

Same here (Ubuntu 16.04, Wire 2.11.2685). Only some conversation windows cause 20-25% CPU usage (no GIFs or animations). When the main window is closed, the CPU usage is below 2-3%.

@gc0c5f
Copy link

gc0c5f commented Feb 25, 2017

I've just noticed a massive CPU usage during calls. I'm using Kubuntu 16.10 and the AppImage v2.11.2722. When making a video call I got 90% CPU usage cannot use a browser anymore, for example. The person which I called had a similar high usage, using Windows 10. I think we both have an intel i5-4300U CPU. We did not send any GIFs. When idling -without any calling going on- everything seems to be fine.

//edit: we did write some text though, so it could be a dublicate of #407. I'll try to make a call again, soon.

@rbieb
Copy link

rbieb commented Apr 20, 2017

Can confirm the issues with wire helper. Wire helper constantly uses 30% cpu (as reported by activity monitor on macOS) while the wire app is in foreground. Would be really nice if this could be fixed.

@maximbaz
Copy link
Contributor

maximbaz commented Apr 22, 2017

I was trying to investigate a little bit, here's what I found:

  • It definitely depends on the currently active conversation. Right now I have several conversations, opening some of them results in constant 30% CPU usage, opening others immediately drops to 0% CPU usage.
  • It doesn't seem to depend on the content in the currently visible area. One high-cpu conversation has only text in the visible area, while another conversation uses 0% CPU and has youtube video and a link as the last messages.
  • It doesn't seem to depend on the age of the last message in the conversation, e.g. one of the conversations that had no messages for the past 2 days is a high-cpu consuming one.
  • It doesn't seem to depend on the ongoing download/decryption activity, e.g. I left Wire open on a high-cpu tab for more than an hour, I didn't touch Wire during this time, nobody wrote or called me during this time, and CPU usage is still ~30%.
  • The CPU usage per conversations is persistent, i.e. I restart Wire and all conversations have the same behavior, high-cpu consuming remain high-cpu consuming, and low-cpu consuming remain low-cpu consuming.
  • Chrome DevTools shows nothing significant on the Rendering and Animation tabs.
  • Chrome DevTools is showing a difference on the JS CPU profiling, but it is a cryptic one:
    • This is a ~10 sec recording when a high-cpu conversation is opened:
      image
    • And this is a ~10 sec recording when a low-cpu conversation is opened:
      image

Notice the difference in the something called (program), on a high-cpu conversation this takes 2 out of 10 seconds to compute, while on a low-cpu conversation it consumes almost nothing.

Google search tells me that (program) is a chrome instance itself, but this CPU usage is clearly induced by Wire somehow, as different active conversations produce different results.

Does anyone have any suggestions on how to dig deeper and learn what actually is happening during those 2 out of 10 seconds?

By the way, if someone is interested but cannot reproduce locally, I'm open to a screensharing session 😉

@maximbaz
Copy link
Contributor

maximbaz commented Apr 22, 2017

Figured it out, it is a three-dots animation running above the images until they are loaded that makes some conversations consuming lots and lots of CPU. To check for yourself, just start wire with --devtools, open a high-cpu consuming conversation and execute jQuery(".image-placeholder-icon").remove() in the console - the CPU usage will immediately drop to 0%.

The bug is filed as wireapp/wire-webapp#1112, let's hope we get a quick hotfix - I can't stand seeing my laptop's battery dying so quickly because of Wire.

@anatoli26
Copy link

Maxim, great analysis! I can confirm that jQuery(".image-placeholder-icon").remove() in devtools console reduces CPU usage to almost 0 (Ubuntu 16.04, latest Wire 2.13.2739 from the PPA) in every chat you execute it.

@rbieb
Copy link

rbieb commented Apr 22, 2017

Can confirm as well. This fixes the issue. Awesome analysis maxim!

@ffflorian
Copy link
Contributor

Thanks everyone for reporting!

Closing this since the issue was fixed in wireapp/wire-webapp#1115 and will be included in the next release. 🙂 Feel free to reopen if the issue persists.

@rkarlsba
Copy link

If I leave wire running for some time, it does the same. Fans start whining and I have to restart wire to fix it. This is on macOS 10.15.4 with wire 3.18.3728

@wwmbes
Copy link

wwmbes commented Sep 14, 2022

Version 3.24.2939 on Ubuntu 20.04 does the same.
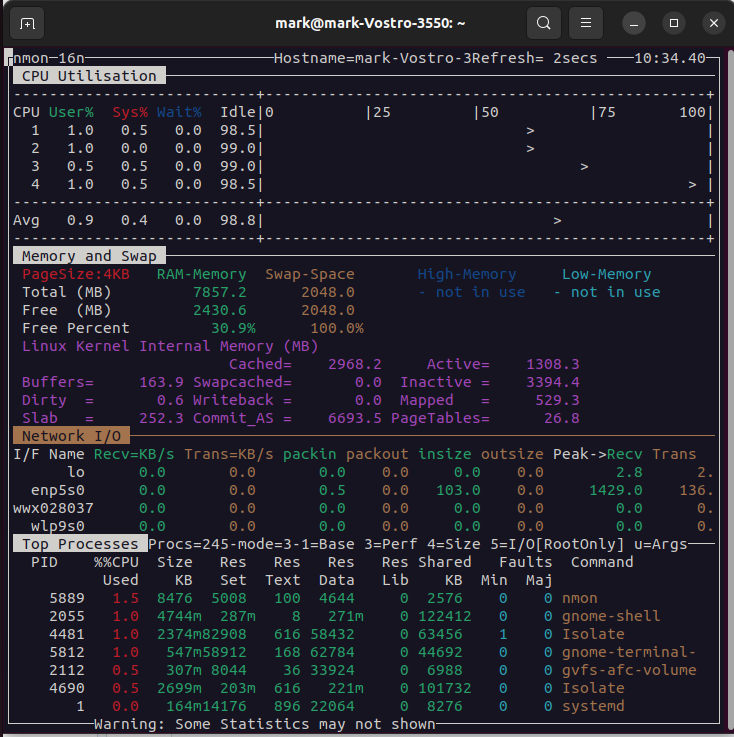
Refer to two nmon screeenshots attached, taken 1 minute apart below. Then ... (see below the first two screenshots)
Screenshot from 2022-09-14 09-58-53
Screenshot from 2022-09-14 09-59-11
Then when wire is shut down from the front-end, it leaves three processes running in the background. See nmon screen shots, 1 minute apart, below:
Screenshot from 2022-09-14 10-10-45
Screenshot from 2022-09-14 10-11-10
The following is the output from the command: ps -eaf | grep wire
Screenshot from 2022-09-14 10-19-35
Anybody got any ideas why Wire is doing this?
After killing the wire processes, the following is the nmon output.
Screenshot from 2022-09-14 10-34-54

Sign up for free to join this conversation on GitHub. Already have an account? Sign in to comment
Labels
None yet
Projects
None yet
Development

No branches or pull requests