Product Specifications
Mapping tree cover with remote sensing is vital for monitoring deforestation, restoration and trends in global land cover change. However, there remains considerable uncertainty about the distribution of tree cover in drylands and in areas with non-forest land use, where patches of trees may cover a smaller area than individual satellite pixels. The launch of the Sentinel satellites in 2015 increased the resolution of freely available remote sensing data to 10 meters, improving tree detection in non-forested areas, especially in drylands, urban areas and on cropland, as well as our ability to monitor trees at small spatial scales.
Here we present two novel datasets:
- Tree extent: the intersection of a 10m pixel centroid by one or more tree canopies. We mapped tree extent probability continuously at a 10m resolution, which is defined as the probability of one or more tree canopies intersecting the centroid of a 10 x 10m pixel.
- Tree cover percent: continuous data representing the average tree extent probability for all pixels within a 70 × 70 m region.
The data is derived from multi-temporal convolutional neural network models applied to Sentinel optical and radar satellite data with methods that build off those in Brandt and Stolle (2020).
The data maps tree extent and tree cover percent within non-deserted regions of the tropics (-23.44° to 23.44° latitude), totaling 4.35 billion hectares.
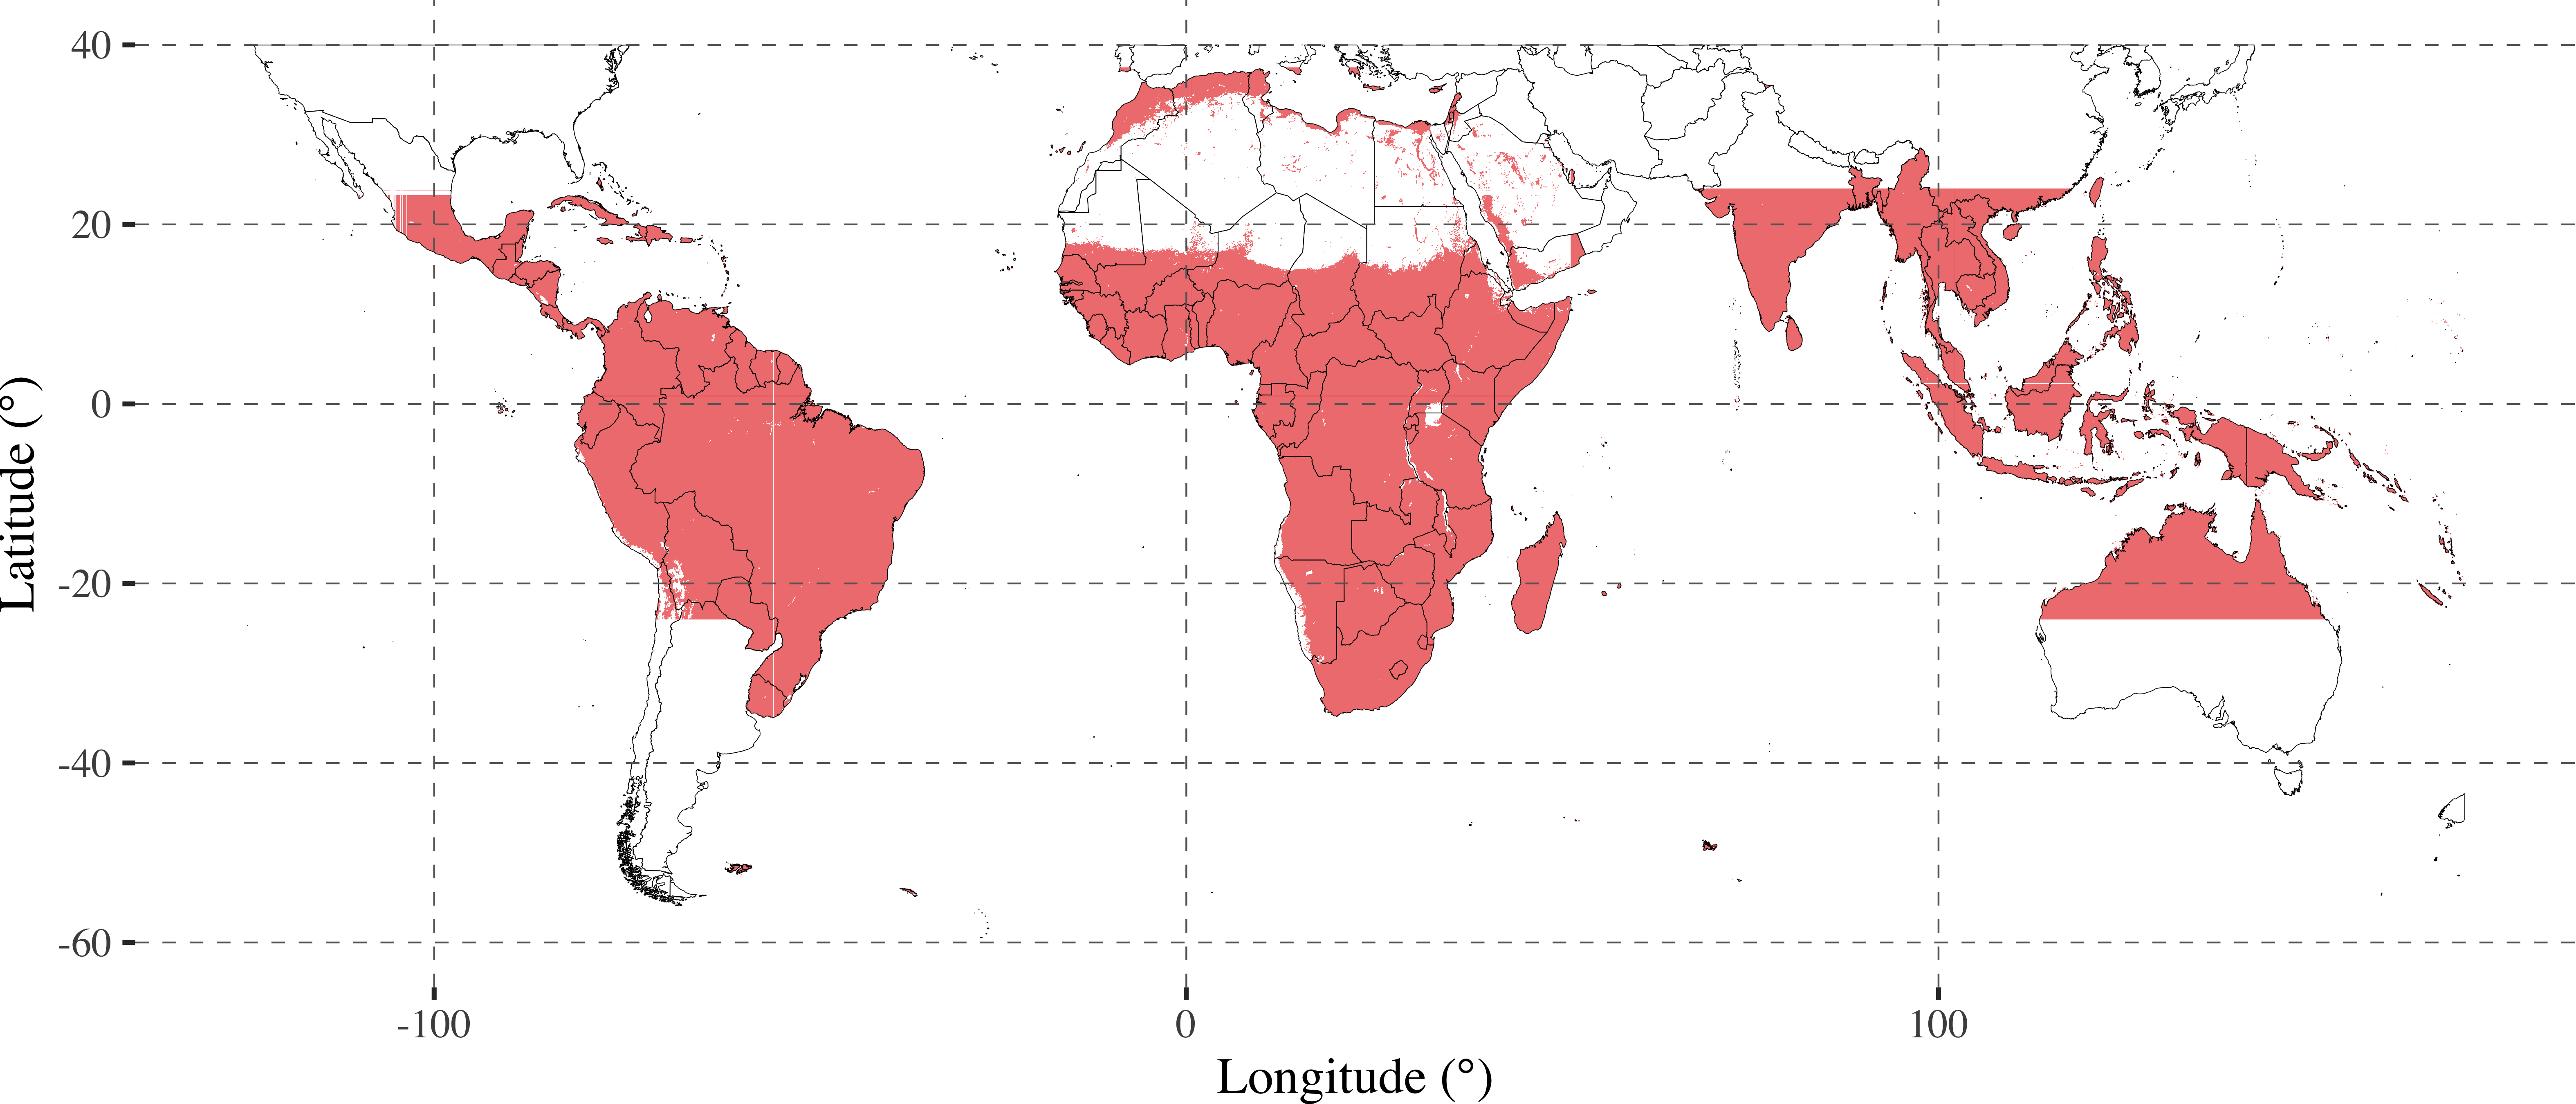
Figure 1. Tropical Tree Cover processing extent covering 4.35 billion hectares.
Data is available for all geographic regions with at least 1 cloud-free image for the processing year. If cloud-free imagery for the processing year was not available, the closest available year was used. Some (<0.1%) of tiles are missing due to corrupted or missing satellite data. Data is released by country in WGS 84 (EPSG: 4326) for the 2020 calendar year as an 8-bit TIF file with a no-data flag value of 255.
We utilize the Sentinel-2 and Sentinel-1 optical and radar satellite data with a time-series convolutional neural network to perform image segmentation on monthly composite images. A full description of the methodology can be found in Brandt and Stolle (2020) with the following modifications to further improve performance for detecting small and scattered trees:
Data Preprocessing
- Capping the maximum number of images per year at 12 to reduce data throughput requirements and replacement of monthly mosaics with biweekly mosaics to reduct noisiness in cloudy regions
- Improving Sentinel-2 image selection by instituting inter-quartile range (IQR) thresholds
- Instituting saturation thresholds and azimuth/zenith thresholds to improve the quality of input images
Data Processing
- Training the model on 18,100 training sample plots sized 140 x 140m
- Applying terrain flattening to the Sentinel-1 data
- Improving cloud shadow detection
- Altering the neural architecture, including the use of group normalization, swish activations, a wider field of view, and improved hyperparameter tuning
- Additional data augmentation and model regularization method, including sharpness aware minimization (SAM) and stochastic weight averaging (SWA)
- Adjusting the input remote sensing indices based on hyperparameter tuning
Training and validation data were labeled by the authors on Collect Earth Online. A total of 18,100 sample plots sized 140 x 140 meters were labeled with sampling points positioned at 10 meter intervals for 196 samples per plot (Figure 2). Pixels were marked positive if their centroid intersected a tree, as identified through photointerpretation of high-resolution satellite imagery.

Figure 2. Locations of 18,100 training sample plots.
We defined a tree as woody vegetation that is either >5 m in height regardless of canopy diameter, or is between 3 and 5 m in height with a crown of at least a 5-m diameter.
Tall herbaceous vegetation such as sugarcane, bananas, and cacti, and short woody crops such as tea and coffee were not considered trees for the purposes of generating labeled training and testing data. are excluded. This definition is different than in Hansen et al. (2013), where all vegetation above 5 meters in height is included, regardless of whether it is woody. Tree-based plantations, such as eucalyptus and avocado are included. When generating training data, vegetation height was estimated by visual interpretation and was not directly modeled with remote sensing. For sample areas with uncertain vegetation height, photo-interpretation was guided by the presence of a shadow in high-resolution imagery, by interpreting field photography (from Google Maps imagery, Google StreetView, and regional forestry experts), and/or by considering national or global land cover and ecoregion data.
The validation data consisted of 1,417 separate set-aside 140 × 140 m plots, corresponding to 277,732 individual pixels, labeled with the same criteria and process as the training data. The validation data sampling schema was a stratified random sample by subregion, ensuring that at least one sample fell within each ecoregion of the processing extent and that there was a minimum distance of 5 km between training and validation data points.
The validation plots were labeled independently of the model training and calibration and were used to assess only the final model. The validation dataset was used to calculate user's and producer's accuracy for the 10-m tree extent data and for tree cover for the subregion strata and land cover and aridity zone subpopulations. (Figure 3).

For the 10-m tree extent data, we calculated user's accuracy (UA, 100% - commission error) and producer's accuracy (PA, 100% - omission error) at the per-pixel scale by first converting tree extent probability to a binary tree extent map by applying a probability threshold of 0.35, which was empirically derived from model evaluation of the receiver operating characteristic curve. To establish confidence intervals for our accuracy assessments, we conducted 10,000 bootstrap iterations to resample plots with replacement for each subregion strata and aridity zone and land cover subpopulation of the validation dataset. We additionally analyzed the UA and PA for a range of patch sizes (the number of connected pixels) within the validation data.
For the 70 × 70 m tree cover data, we calculated UA and PA for ≥10% and ≥ 40% tree cover thresholds and 1-9% and 10-39% tree cover ranges for the subregion strata and aridity and land cover subpopulations with at least 20 samples. We also calculated R2 and root mean squared error (RMSE) between the predicted and labeled tree cover data. Next, we validated our tree cover definition by comparing the RMSE, UA, and PA of tree cover from averaging tree extent probabilities versus binary thresholded values across spatial scales and tree cover categories.
Lastly, we assessed the sensitivity of our dataset to different woody vegetation types such as shrubs, woodlands, and forests. The lack of recent, spatially granular reference data on woody vegetation limited our ability to conduct a systematic, metric-based analysis of omission and commission errors by vegetation type. Instead, we analyzed the Africover woody cover dataset for the United Republic of Tanzania to evaluate the predicted tree cover distribution across different categories of woody vegetation. More information on this analysis can be found in our publication in Section 2.6 and Section 3.
Comparing our generated tree extent data with the validation set-aside data yielded 94.0 ± 0.1% overall accuracy, 96.1 ± 0.4% UA, and 97.0 ± 0.5% PA for 10-m binary tree extent detection across the tropics, with strong performance across geographic regions, aridity zones, and land cover classes (Figure 4). In non-forested land covers, our data maintains between 70 and 95% UA and PA, with the lowest accuracy numbers occurring in urban areas. We find aridity to have a strong influence on model accuracy, with considerably lower accuracy in hyper-arid and arid zones.
Comparing our generated tree cover map with the validation set-aside data yielded R2 = 0.928, RMSE = 12.23 (Figure 5). The mean difference of -2.2% indicates a slight underestimation of tree cover compared to validation data. The UA and PA is 92.5 ± 0.5% and 94.6 ± 0.5% for ≥10% tree cover, and 92.9 ± 0.5% and 89.4 ± 0.6% for 0-9%, respectively. As expected, we achieve substantially higher accuracy for identifying closed canopy areas (≥40%, UA = 96.1 ± 2.5%, PA = 94.1 ± 3.4%) than open canopy areas (10-39%, UA = 66.7 ± 3.3%, PA = 69.3 ± 1.5%). Evaluation of UA and PA for areas with ≥10% and ≥ 40% tree cover by land cover class, aridity zone, and subregion finds the lowest accuracies in hyper-arid and arid regions, and in shrub/scrub/otherland.
Additional information on our validation analyses can be found in our publication.


Data for some regions are subject to change in the future to address the following limitations. Inconsistent imagery selection during the data production process may cause inaccurate predictions or visual artifacts in the data. Visual artifacts are artificial distortions in the image that degrade the performance of the image analysis. The issue, which can appear as a line or region of partially inconsistent pixel values in the image, stems from inconsistent imagery selection between neighboring tiles or issues with the underlying raw satellite imagery.
During the production of this dataset, we have improved the image processing pipeline to remove artifacts where possible. However, due to the massive computational scale of this project, not all regions have been back-processed with the most recent image processing pipeline. We will attempt to mitigate artifacts by re-processing regions when possible.
We are aware of the following types of artifacts:
- Artifacts at the boundaries between Sentinel orbits, which takes place at 290 km longitudinal intervals. Canopy shapes and brightness can be represented differently due to the different angles at which Sentinel satellites acquire images, resulting in high variability in a canopy’s spectral signature. This makes it much harder to use remote sensing vegetation indices to distinguish tree cover.
- Artifacts due to cloud cover. In some regions, tree cover predictions proximal to locations that had no cloud-free images in the Sentinel 2 archive are erroneous. This was fixed as of 04/20/2022 and affected regions will be re-processed in the future.
- Artifacts due to image normalization. When stitching multiple images together to make a wall to wall map, the available cloud-free image dates may be entirely different between two adjacent locations within 10 km of each other. In these situations, we normalize the band reflectances between the images. This is subject to error if there is a large underlying land use difference between the locations. In the future, data in these regions will be removed, because there is no feasible way to mitigate the artifacts.
- Artifacts due to outdated processing methods. When we detect an issue, or improve upon a process in the data production, we have attempted to back-process regions that are affected the most. However, some smaller areas have not been re-processed. In the future we will release a data quality flag layer to specify where these issues arise, though it affects less than 0.5% of the area. We will also continue to re-process affected areas when possible.
- Artifacts due to processing version used. During the data creation, we have sought to continually improve the methodology and results. While we attempt to re-process affected areas when an improvement is made, this is not always possible. In the future, we will both a) release a raster dataset specifying the model version used for each pixel and b) future data releases will all be harmonized, as we have hopefully concluded our processing pipeline updates.
The Tropical Tree Cover (TTC) data set maps tree cover across the tropics at a 10-meter resolution for the year 2020. This data set is based on imagery from Sentinel satellites, which increased the resolution of freely available remote sensing data to 10 meters when launched in 2015. Other global tree cover products rely on 30-meter Landsat satellite imagery, which is usually not granular enough to map open canopy forests or small disturbances in closed canopy forests. We utilize Sentinel-2 and Sentinel-1 optical and radar satellite data with a time-series convolutional neural network to perform image segmentation on monthly composite images. Our methodology, which builds on Brandt and Stolle (2020), improves performance for detecting tree cover in non-forested areas, especially in drylands, urban areas and on cropland, as well as our ability to monitor trees at small spatial (local) scales. Learn more about the similarities, differences and uses of TTC and other tree cover data available on Global Forest Watch (GFW) here.
At present, the data is a single-year snapshot of tree cover for the year 2020. Our team is working on change detection pilot projects, which will stem back to 2016/2017 and provide insights on tree cover gain and loss. Year-over-year change detection data could have important implications for global carbon models as sustainable land management agendas, especially for geographic regions that have typically been underserved by remote sensing-based monitoring models, such as drylands and other areas with small-scale agriculture.
This data product measures tree extent, which we define as the intersection of a 10m pixel centroid by one or more tree canopies. This means that individual trees are not explicitly mapped. In areas with scattered, open canopy ecosystems, it is often possible to count individual large trees, but this data is concerned with measuring tree extent, not count.
We define a tree as woody vegetation that is either >5 m in height regardless of canopy diameter, or is between 3 and 5 m in height with a minimum 5m diameter canopy. Tall herbaceous vegetation such as sugarcane, bananas, and cacti, and short woody crops such as tea and coffee were not considered trees for the purposes of generating labeled training and testing data. This definition is different from Hansen et al. (2013) which considers all vegetation taller than 5m in height as trees.
When labeling vegetation for inclusion or exclusion in our tree definition, height was estimated by visual interpretation and was not directly modeled with remote sensing. For sample areas with uncertain vegetation height, photo-interpretation was guided by the presence of a shadow in high-resolution imagery, by interpreting field photography (from Google Maps imagery, Google StreetView, and regional forestry experts), and/or by considering national or global land cover and ecoregion data.
When labeling vegetation for inclusion or exclusion, height was estimated by visual interpretation and was not directly modeled with remote sensing. For sample areas with uncertain vegetation height, photo-interpretation was guided by the presence of a shadow in high-resolution imagery, by interpreting field photography (from Google Maps imagery, Google StreetView, and regional forestry experts), and/or by considering national or global land cover and ecoregion data. Similar to Bastin et al. (2017), we considered samples where vegetation height was unable to be determined as trees.
The data does not distinguish trees by species. The leaves and branches of different tree species uniquely reflect spectral bands, which can aid in the identification of species. However, there can be variation in how these spectral bands are reflected within a species, due to tree age, health, slope, altitude, phenology and time of day, which makes identification harder.
This data is valuable in its contribution to emissions evaluations because it provides more granular insight on where carbon sequestration might be happening spatially. However, the data is only capable of informing estimates at this time. We are currently testing applications of this data set to model aboveground biomass and carbon change on tree planting sites to more accurately monitor carbon removals from restoration and regrowth. Results of these research initiatives will help to better understand tree cover dynamics in the tropics, monitor the progress of smallholder restoration projects and estimate carbon sequestered by these efforts.
Measuring and validating the results of a planting project or naturally regenerated area using this data requires a minimum of between 3 and 5 years, depending on growing conditions. As this dataset only represents the year 2020, the tree planting project must have taken place between 2015-2017 (approximate) in order for tree canopies to be mapped.
At present, the code and methodology available on GitHub are designed for processing Sentinel 1 and Sentinel 2 imagery. It would be possible to apply the methodology to Planet or Landsat imagery. However, many of the preprocessing steps, such as cloud removal and vegetation indices, are currently tailored to the spectral bands for Sentinel 2.
Inconsistent imagery selection during the data production process may cause inaccurate predictions or visual artifacts in the data. Visual artifacts are artificial distortions in the image that degrade the performance of the image analysis. The issue, which can appear as a line or region of partially inconsistent pixel values in the image, stems from inconsistent imagery selection between neighboring tiles or issues with the underlying raw satellite imagery. Please look at the limitations section above for more details and future plans to address the inconsistencies.
The Tropical Tree Cover data set is available for viewing on Global Forest Watch and for download on WRI’s Open Data Portal. Click here and scroll to "Download the Tropical Tree Cover Data" for instructions on downloading TTC tiles from the Open Data Portal.