Possible memory leak? #133
Comments
|
I've also noticed that despite |
|
Thanks for filing this @MasterGroosha, we definitely want to look into this. For now, if anyone with experience with Go profiling tools wants to help out, that'd be a huge help! (As for the logging, I'd suggest updating the Systemd service to the current config shown in the Getting Started guide.) |
|
Are we sure its not a goroutine leak? In my experience thats usually more common. Terminating the process with |
That doesn't look quite correct. |
|
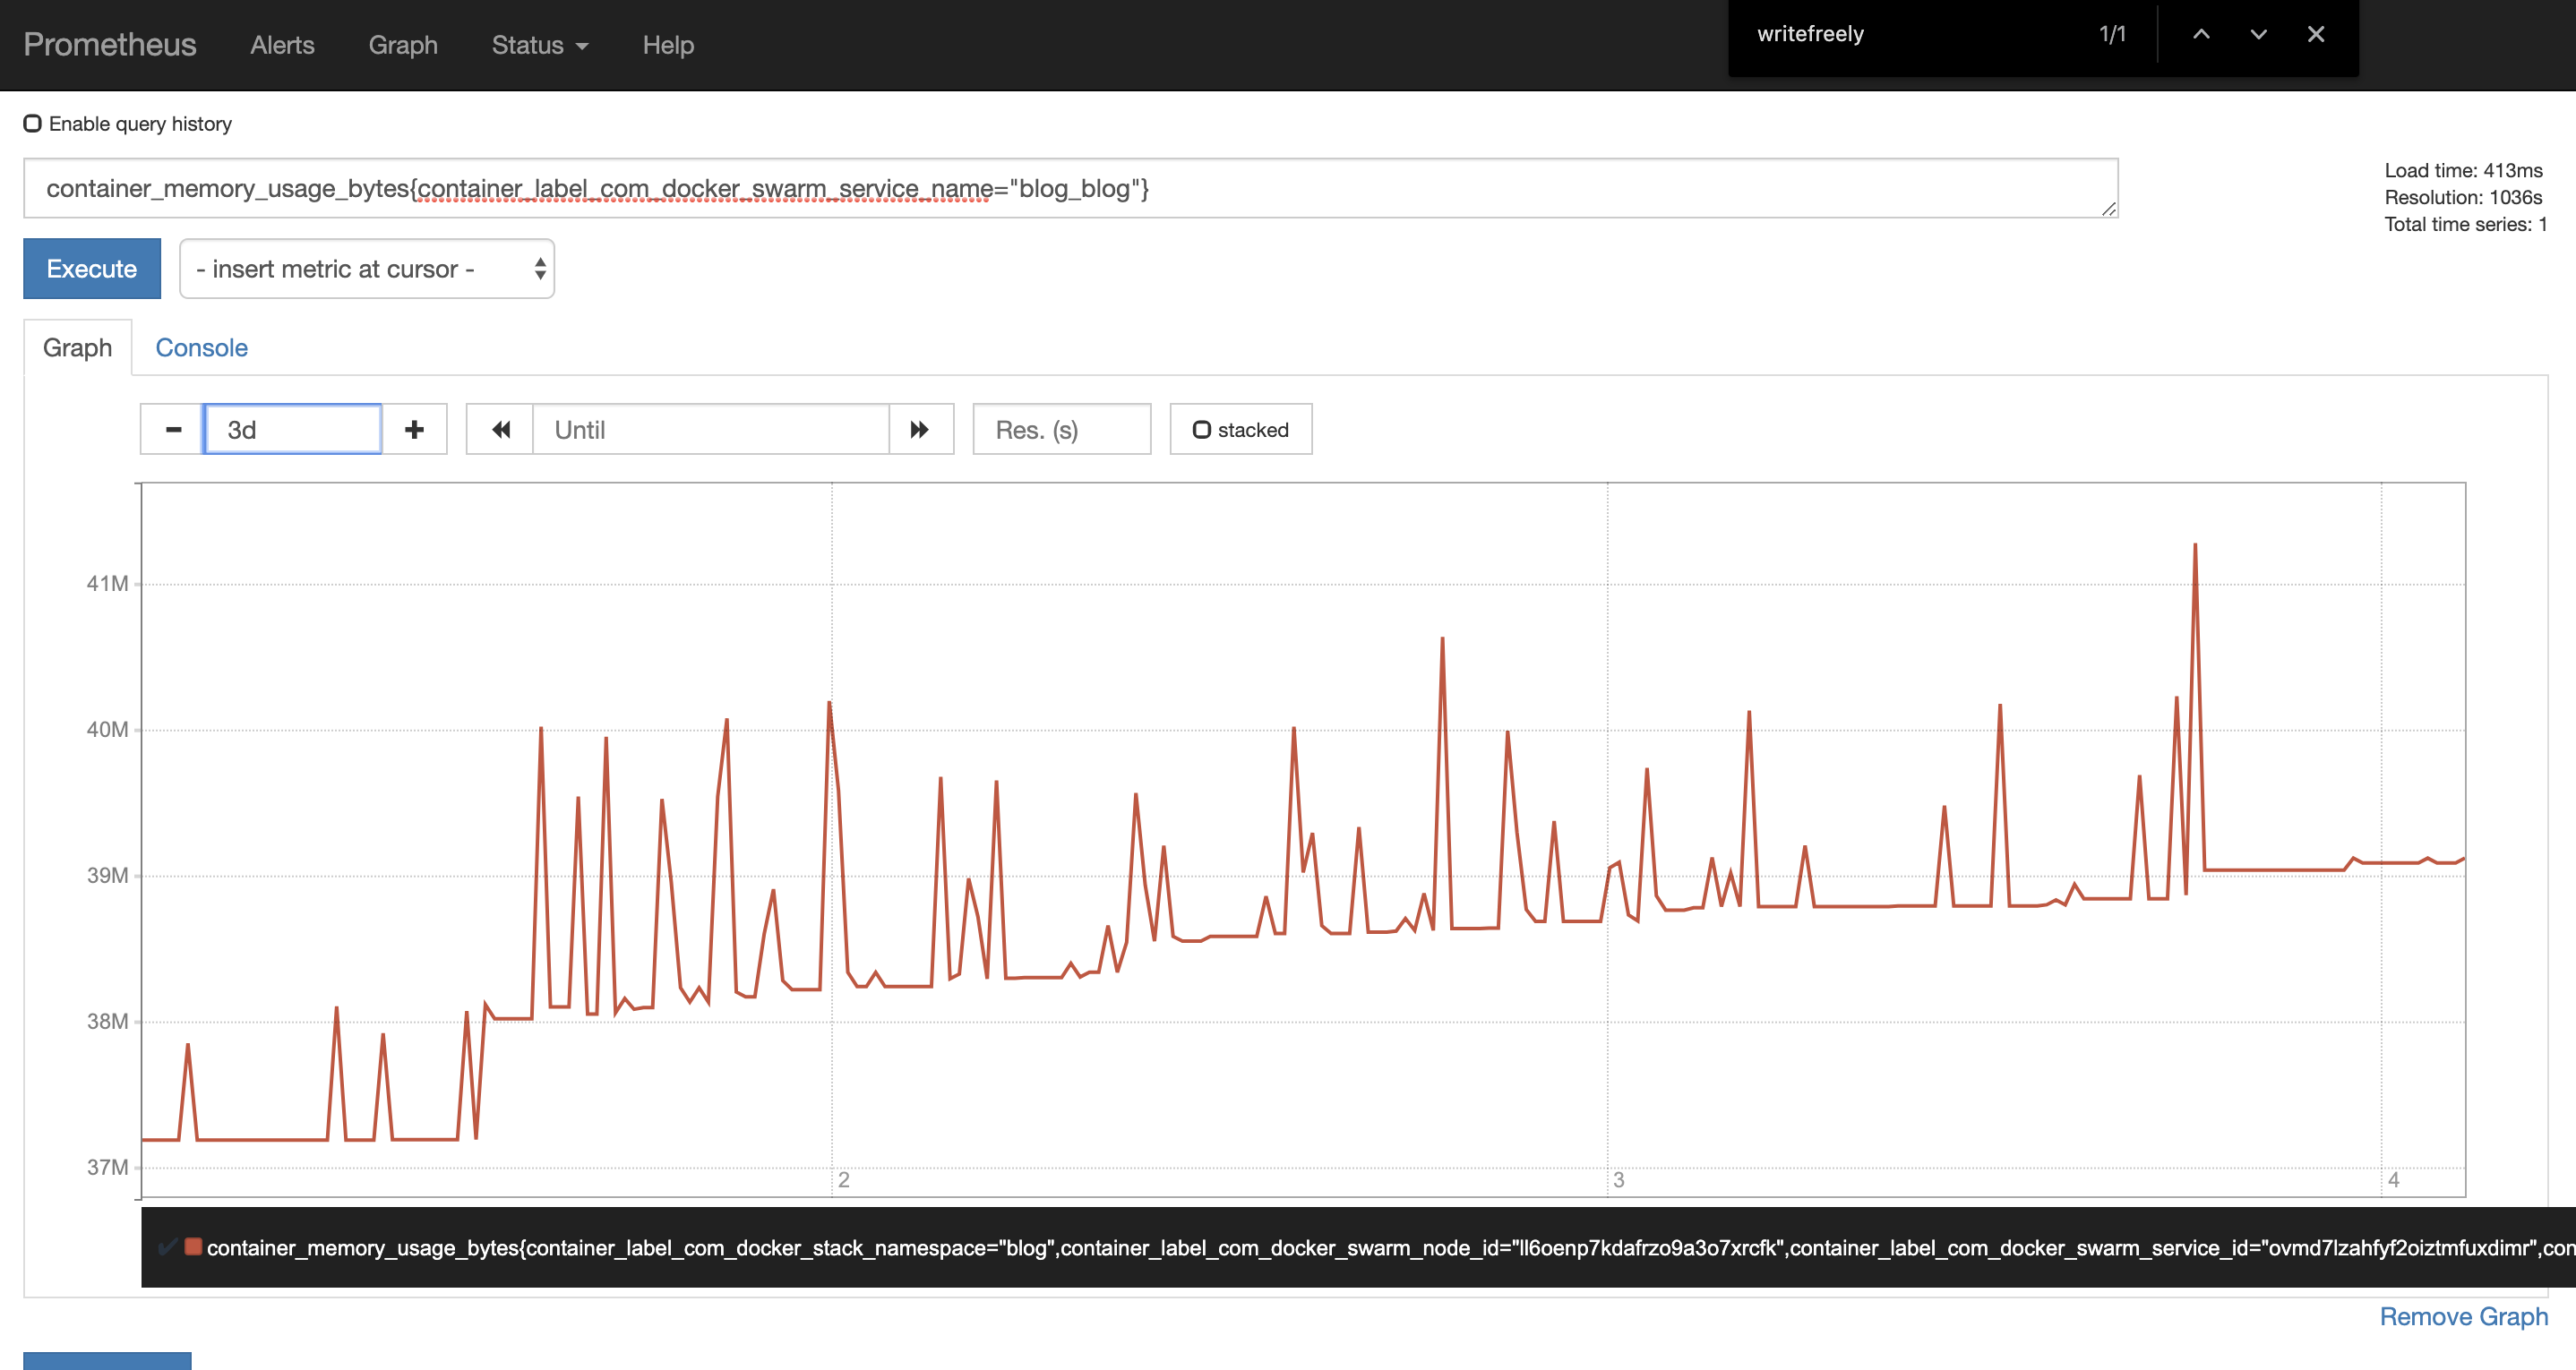
I can also confirm this memory leak in my own instance (I don't recall which version specifically) with this Prometheus query:
|
|
@thebaer If you add instrumentation like in https://prometheus.io/docs/guides/go-application/ this will help debug this and monitor instances runtime behaviour more reasily. I'm happy to put up such a PR and documentation for this (more of an ops features than a user-facing one -- but a Admin UI could be developed to pull in some useful data/graphs too). |
|
I'm preparing for migration, so WriteFreely instance will be stopped. Now it consumes 13.7% memory with the following stats from admin webpage: |
|
@prologic That'd be great! Please feel free to submit a PR. At least one user has requested this feature, and I think it'd be a great addition beyond solving this issue. |
This gets rid of the gorilla/context dependency, which might have been
causing a memory leak.

We noticed some serious memory leakage on Write.as that seemed to point
to this library. One heap snapshot:

      flat  flat%   sum%        cum   cum%
  259.13MB 30.41% 30.41%   268.13MB 31.46%  net/textproto.(*Reader).ReadMIMEHeader
  105.71MB 12.40% 42.81%   105.71MB 12.40%  github.com/gorilla/context.Set
   78.53MB  9.21% 52.03%   125.53MB 14.73%  github.com/gorilla/sessions.(*Registry).Get
   55.51MB  6.51% 58.54%    82.52MB  9.68%  net/http.(*Request).WithContext
   38.01MB  4.46% 63.00%    38.01MB  4.46%  github.com/gorilla/mux.extractVars
      35MB  4.11% 67.11%       53MB  6.22%  context.WithCancel
   34.50MB  4.05% 71.16%    34.50MB  4.05%  context.WithValue
      27MB  3.17% 74.32%       27MB  3.17%  net/http.cloneURL
      26MB  3.05% 77.38%       26MB  3.05%  github.com/gorilla/sessions.NewSession
      18MB  2.11% 79.49%       18MB  2.11%  context.(*cancelCtx).Done
   16.50MB  1.94% 81.42%    16.50MB  1.94%  syscall.anyToSockaddr
      14MB  1.64% 83.07%       47MB  5.52%  github.com/gorilla/sessions.(*CookieStore).New
   13.50MB  1.58% 84.65%    51.51MB  6.04%  github.com/gorilla/mux.(*Route).Match
   11.67MB  1.37% 86.02%    13.21MB  1.55%  regexp.(*Regexp).replaceAll
    9.72MB  1.14% 87.16%    22.94MB  2.69%  regexp.(*Regexp).ReplaceAllString
    9.50MB  1.11% 88.28%   115.21MB 13.52%  github.com/gorilla/sessions.GetRegistry

With the help of these articles, we tracked it down to this dependency,
and upgraded the library, which seems to have completely fixed the issue
so far:

https://rover.rocks/golang-memory-leak/
https://medium.com/@walterwu_22843/golang-memory-leak-while-handling-huge-amount-of-http-request-35cc970cb75e

This should fix #133
|
Thank you, @thebaer! |
|
Sure, no problem. Here's the build for this branch: writefreely_0.11.2-88-g8fce34b_linux_amd64.tar.gz |
|
@thebaer I've just started to deploy the version you've built for me and I've got a strange error. My config:
When this error appeared for the first time, I decided to try again with the same config and it said "Database already initialized". Trying to start Writefreely results in error: Upd: my bad, I forgot to run |
|
Ah, our latest migrations don't work with SQLite -- sorry about that. We should have that fixed in the near future, but it's probably best to avoid this version in production for now if you're using SQLite. |
|
@thebaer by the way this version seems to be working (at least, I managed to deploy and create a post). |
|
Okay awesome. We're seeing the same results on Write.as, so I think
we'll merge the fix now. But please report here if anything comes up.
|
Describe the bug
I'm running WriteFreely v 0.9.1 on my Scaleway instance with 2GB of RAM. It's a single-user federated instance with SQLite as backend. I'm managing it via systemd with the following service description:
The only modification I made is replacing one of "letter-avatars" with a custom one to see a proper profile pic on Mastodon.
Symptoms
If I run WriteFreely for a long time (let's say, a month) without even touching it (no users, no new posts, nothing), it consumes almost all free RAM on server, causing other apps to have problems.
For example, my Python scripts which are running as cron jobs and regular processes, raise some exceptions like
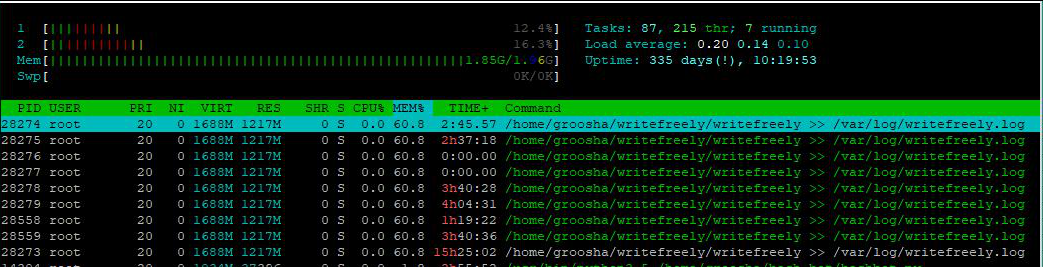
RuntimeError: can't start new threadorvedis.cpython-35m-x86_64-linux-gnu.so: failed to map segment from shared object. Also running htop shows thatwritefreelyprocess consumes ~60% of RAM:(notice that I'm running only one process, but htop shows all threads)
After I restart writefreely with

systemctl restart writefreelyeverything gets back to normal:(here I enabled "tree" view of processes, showing that I have only 1 process of writefreely and others are most likely threads)
My bad I didn't write down Go internal stats from /admin page, I guess it would help a lot.
Expected behavior
RAM usage should depend on active users or API usage, not increase as the time goes by.
Application configuration
Version or last commit: 0.9.1
The text was updated successfully, but these errors were encountered: