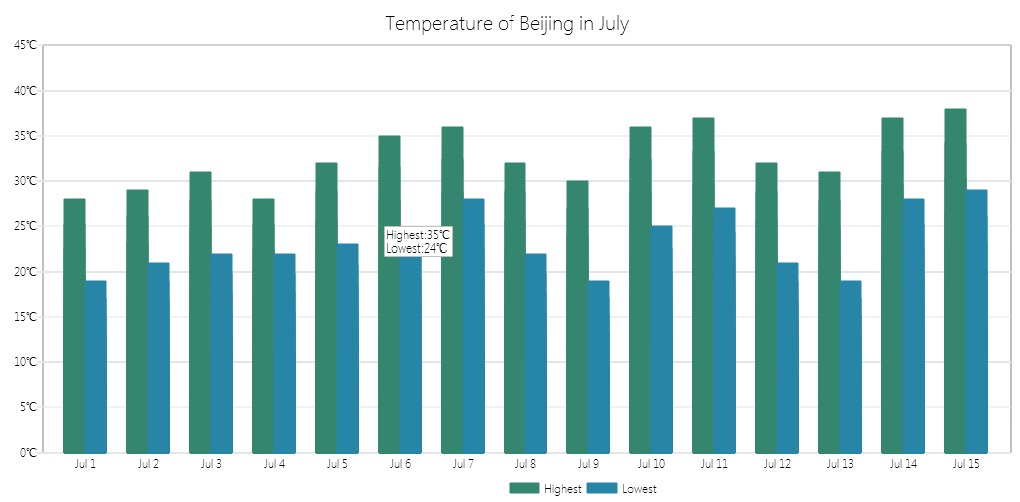
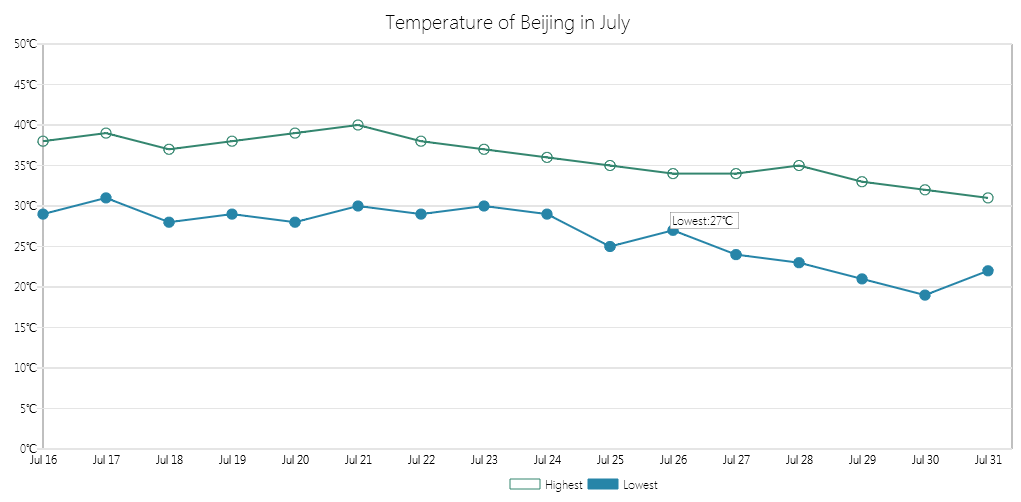
zChart is a HTML5 chart library which use canvas element to draw 2D chart. Simple bar chart and line chart are included. It is highly customizable and supports tooltip and animation.
All you need to do is to new an instance and pass parameter to it.
var canvas = document.getElementById("zChartCanvas");
var chart = new zChart.LineChart(canvas, param);
chart.drawChart();
Bar Chart example is here. Line Chart example is here.
zChart is available under the MIT license.