Releases: xieguigang/sciBASIC
Test framework installer
- Merge softwaretoolkit namespace into ApplicationSerivces namespace
- Improvements on the CLI framework console output of the CLI help info by using
App ? <command> - Rewrite the charting plot gdi API component
- Add excel xlsx read API based on the openXML
sciBASIC# Graphics Artist Project
- Fix the error of the dynamics color expression translator
- Add vendor 3mf 3D graphic model reader, which is avaliable in Microsoft.VisualBasic.Imaging.Drawing3D.Landscape.dll
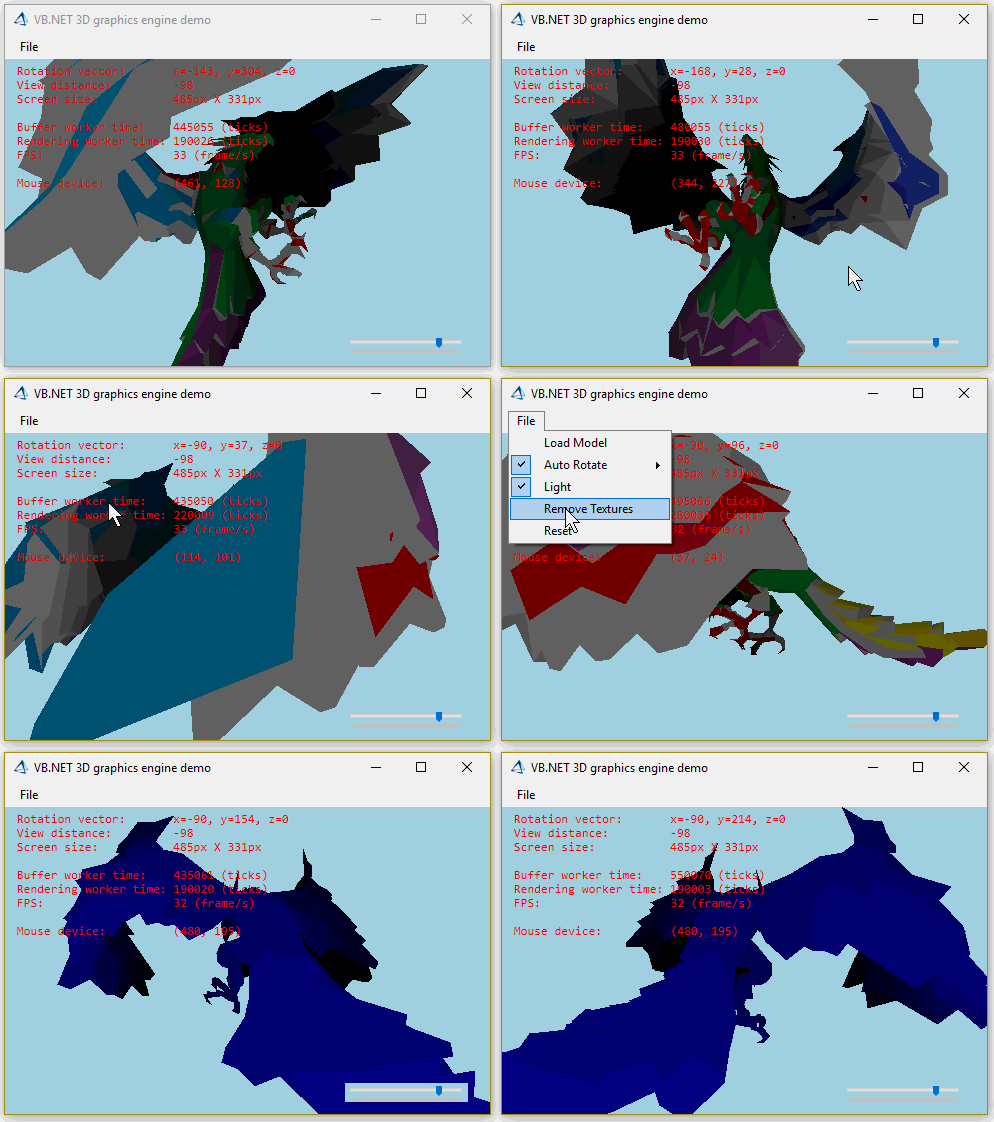
- Improvements on the 3D graphics control for winform
- fix the math expression stack for the math function invokes
- Add R language like optional parameter scripting language feature, you can apply this new feature using Microsoft.VisualBasic.Mathematical.Scripting.ParameterExpression.Apply(System.Linq.Expressions.Expression(Of System.Func(Of Object()))) in dll module: Microsoft.VisualBasic.Mathematical.dll
- csv file namespace renamed to Microsoft.VisualBasic.Data.csv.IO
- Move math expression types to namespace Microsoft.VisualBasic.Mathematical.Scripting
- Add string interpolation extensions in the parameter expression
- Great improvements on the 3D graphics engine, which is avaliable in Microsoft.VisualBasic.Imaging.Drawing3D namespace
Details about how to implements the parameter expression, read on this codeproject article: https://www.codeproject.com/Articles/1167903/Optional-Parameter-Expression-in-VisualBasic
C-Means and Parameter Space Analysis
- Fix a internal thread high CPU occupied problem, now this bug in internal threading model for debugger console output is fixed
- Add a scatter heatmap plot for the ODEs system dynamics parameter space analysis
- Add a fuzzy C-Means cluster algorithm in the data mining module
- The namespace of chart plot system have been changes to Microsoft.VisualBasic.Data.ChartPlots
- Fix the bugs of range scaling in the chart plot axis
- Fix the bugs of the ODEs system
Network canvas with 3D and SVG exports example
sciBASIC# network visualization: https://github.com/xieguigang/sciBASIC/tree/master/gr/Datavisualization.Network
Data Fittings Bootstrapping
- Fix a internal thread high CPU occupied problem
- Add a data fitting module using LeastSquares method in dll Microsoft.VisualBasic.Data.Bootstrapping.Fittings.dll
- Add various spline interpolation methods in namespace Microsoft.VisualBasic.Mathematical.Interpolation
- csv serialization module improvements: add custom cell parser in column attribute, you can implements your object parser by implement the interface Microsoft.VisualBasic.Data.csv.StorageProvider.Reflection.IParser
- All possible system states character by using monte-carlo method in module: Microsoft.VisualBasic.Data.Bootstrapping.MonteCarlo.StatesCharacters
Darwinism Computing Module
Add Darwinism computing modules, these module includes:
- Genetic Algorithm Framework
- Difference Evolution module
you can found these module in namespace: Microsoft.VisualBasic.DataMining.Darwinism
Add two curve spline Interpolation module in namespace Microsoft.VisualBasic.Mathematical.Interpolation, includes:
b-spline and cubic-spline
Add a new random generator based on the random number table, which is avaliable at Microsoft.VisualBasic.Mathematical.Randomizer
A data parameter estimates method based on the genetic algorithm , protocol is avaliable in Microsoft.VisualBasic.Data.Bootstrapping.Darwinism
Renames the odes solver as Microsoft.VisualBasic.Mathematical.ODEsSolver.dll
VisualBasic Data Science App runtime
v0.2

base type constrain


