This repository contains the files necessary to get started with the Heart Disease data set from the UC Irvine Machine Learning Repository for analysis in STAT 432 at the University of Illinois at Urbana-Champaign.
README.md: The file that you are reading that describes the analysis and data provided.make-data.R: The R script used to scrape and wrangle the data.check-data.R: An R script used to validate the created data. Contains hints for dealing with the missing data.analysis.Rmd: A template R Markdown file to be used for reporting the results of your analysis.data/hd.csv: The data as created by themake-data.Rscript.heart-analysis.Rproj: An RStudio project file.
The data stored in data/hd.csv was accessed through the UCI Machine Learning Repository.
The data used in the creation of data/hd.csv was collected from the four following locations:
- Cleveland Clinic Foundation
- Hungarian Institute of Cardiology, Budapest
- V.A. Medical Center, Long Beach, CA
- University Hospital, Zurich, Switzerland
The contributors of the data have requested that any publications resulting from the use of the data include the names of the principal investigator responsible for the data collection at each institution. They are:
- Hungarian Institute of Cardiology. Budapest: Andras Janosi, M.D.
- University Hospital, Zurich, Switzerland: William Steinbrunn, M.D.
- University Hospital, Basel, Switzerland: Matthias Pfisterer, M.D.
- V.A. Medical Center, Long Beach and Cleveland Clinic Foundation: Robert Detrano, M.D., Ph.D.
The goal of this analysis is to use the provided data in order to create tool that can be used to screen for heart disease.
The num variable is the "angiographic disease status" which has five levels. The documentation does not appear to be extremely clear about this, so we will assume that the levels mean the following:
v0: 0 major vessels with greater than 50% diameter narrowing. No presence of heart disease.v1: 1 major vessels with greater than 50% diameter narrowing.v2: 2 major vessels with greater than 50% diameter narrowing.v3: 3 major vessels with greater than 50% diameter narrowing.v4: 4 major vessels with greater than 50% diameter narrowing.
In other words, the response variable num is the number of major heart vessels with greater than 50% diameter narrowing. Any value except for v0 indicates some presence of heart disease.
When considering how to use the remaining variables as features, consider how easy these values are to collect. Because STAT 432 is not a medical course, we do not expect you to know with 100% certainty how these variables are measured, but do make clear what your assumptions are about these variables, especially with respect to how they are measured. Are these variables easy to measure, or do they require an invasive procedure?
Be aware of when and where this data was collected.
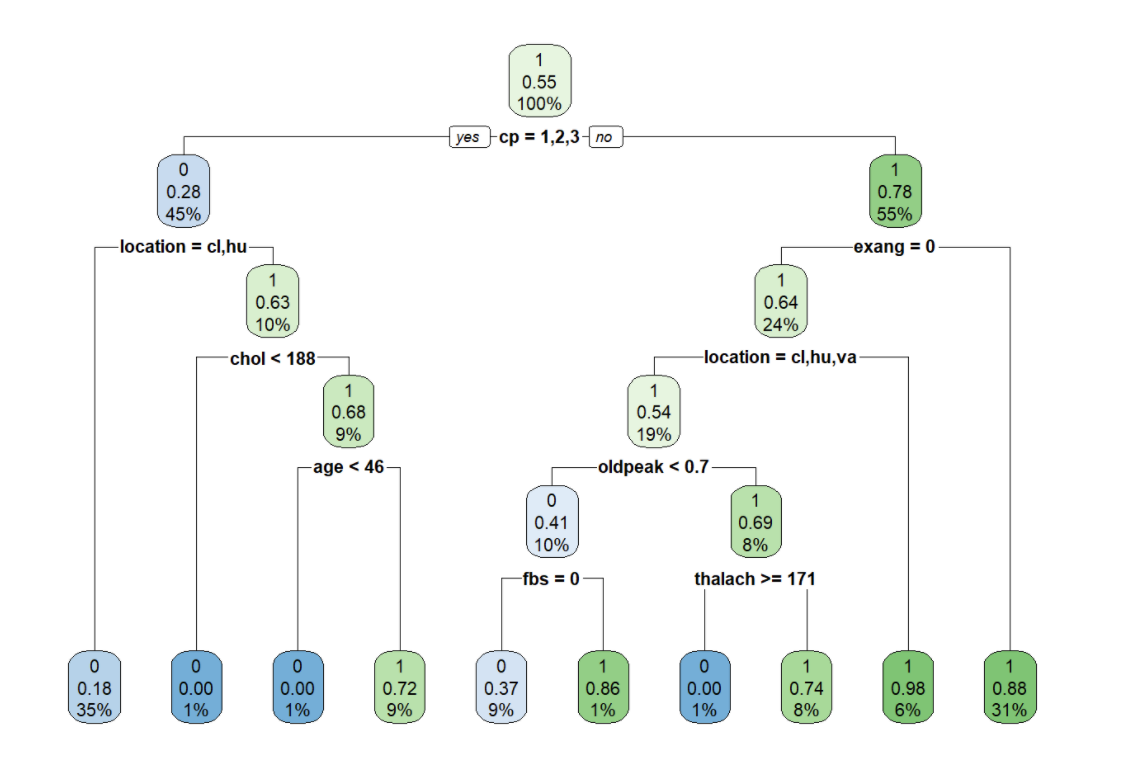
Built tree-based models for heart disease detection with 84% accuracy.
Listed below is a graph demostrate how the decision tree works when fitting the model.