Name: Edward (Yida) Chen
Class: CSCI 349 - Intro to Data Mining
Semester: Spring 2021
Instructor: Prof. Brian King
Dataset: COVID-19 Radiography Database [1][2]
Dataset Repository: Kaggle COVID-19 Radiography Database
In this project, I work on a clinical Radiography dataset that contains 21165 Chest X-ray images from medical institutions [1][2]. Each image has a dimension of 299 x 299 pixels (89401 pixels in total). The project's task is to classify the patients' pneumonia infection using Chest X-ray images.
The four possible classifications for a Chest X-ray image are:
- COVID-19 infection
- Non-COVID pneumonia infection
- Non-COVID pulmonary opacification (lung opacity)
- Normal (non-infected)

The content below will help you get started on running the notebooks and reproduce the results.
You need to install the packages below under a python>=3.7 environment. I suggest creating a virtual environment using Anaconda and install the following required packages through Conda. The links below will redirect you to the packages' installation page on Anaconda.
- Matplotlib >= 3.2.2
- NumPy >= 1.19.1
- scikit-learn >= 0.23.2
- PyTorch: torch >= 1.7.0, torchvision >= 0.8.1
- Pandas >= 1.1.4
- Seaborn >= 0.10.1
Alternatively, you could also run these notebooks on Bucknell's campus machine. To get the required packages, unload and load the following modules:
$ module unload python/3.7
$ module load python/3.7-deeplearn
These notebooks strive to provide the best reproducibility for the results. I manually set the seeds below:
>>> import torch
>>> torch.manual_seed(0)
>>> import random
>>> random.seed(0)
>>> import numpy
>>> numpy.random.seed(0)
Notice that the reproducibility of results from PyTorch modules (e.g. train & test results after retraining the models) is not guaranteed. They may slightly vary across the platforms and devices. See the official documentation of PyTorch for more information about reproducing the results. These notebooks were running on a Linux 64-bit system on a GPU device with CUDA 10.1.
When running the Final_Report.ipynb, you need to download the COVID-19 Radiography Dataset or download the copy of the dataset from the shared Google Drive folder. For more information about the shared files on the Google Drive folder see section 3.4.
The downloaded dataset zip file needs to be decompressed into the ../data/ directory:
./                                  # Project top directory
./data/COVID-19_Radiography_Dataset # Put the dataset folder here
...
./project/*                         # The Project files.
...
If you want to rerun the Modeling.ipynb notebook, but you don't want to retrain the models. You could download the folder, saved_models, of pre-trained DenseNet-121 models from the Google Drive Folder. The downloaded folder of pre-trained models needs to be placed in the ./project/ directory:
./                                   # Project top directory
...
./project/saved_models/*.pth        # Saved models
./project/*                         # The rest Project files.
...
If you have a CUDA-compatible device, you may wish to use your CUDA GPU to reproduce the results. Alternatively, you could run on your CPU devices. Running a GPU will greatly accelerate the execution of Modeling.ipynb notebook. Some cells in the Modeling.ipynb will promote you to change the torch.device("cuda") to torch.device("cpu") if you are using a CPU device. Please make these changes if needed.
This project contains three IPython Notebooks:
3.1 DataPrep_EDA.ipynb:
Ipython notebook for doing Exploratory Data Analysis and Data Preprocessing on the radiography dataset.

I explore the standard statistical measurements (such as mean, median, and std.) on the imagery data, and I further explore the imagery data's special attribute, spatial coherence.

The dimensionality reduction technique, PCA, was performed and assessed on a small subset (400 images) of the dataset (21165).

However, I find a more efficient way to represent imagery data using their spatial features.

3.2 Modeling.ipynb:
Ipython notebook for exploring and training the optimal Convolutional Neural Network for the radiography classification problems.
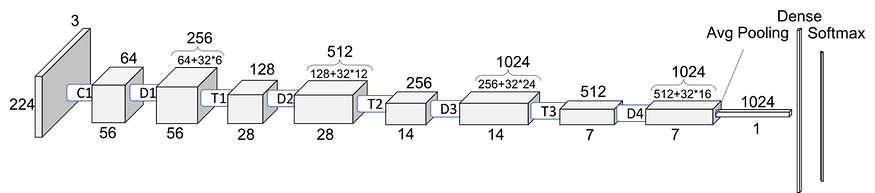
This notebook introduces the machine learning method, Convolutional Neural Network (CNN), used for solving the Radiography classification problem, and the notebook explains the reasons why this method is appropriate.
I explored two CNN architectures: (1) ResNet-50 and (2) DenseNet-121.
Through 5-fold Cross-validation (CV) and hyperparameter optimization using Grid Search, I find DenseNet-121 with Adam optimizer of learning rate==1e-3 and CrossEntropy Loss works best on the dataset.
Applying the 5-fold CV with DenseNet-121 on the whole dataset (21165 images), I acquire a macro f1-score of 0.88 and overall accuracy of 0.87 on the classification of four classes.

I compute the area under the curve (AUC) for each class using the model's raw outputs (before argmax). The AUC of the class COVID-19 is 0.971, the Lung opacity is 0.940, the normal is 0.943, and the Viral Pneumonia is 0.997.

3.3 Final_Report.ipynb:
Ipython notebook for the final report of the project. This notebook provides a summary of what have I explored and achieved on the COVID-19 Radiography Database.
Instead of reproducing the results by rerunning all cells, I provide the saved model parameters, cross-validation results, and grid-search results. They can be accessed from this shared Google Drive folder: https://drive.google.com/drive/folders/1sbCQivUTb2rR2DGrRJdvtKlRdutjzitV?usp=sharing.
Please contact the Project Maintainer, Yida Chen, through email: yc015@bucknell.edu if you have any access issues to the Google Drive folder.
Files on the Google Drive:
- saved_models: A folder of saved parameters of the best DenseNet-121 model in each fold of the 5-fold CV on the whole dataset (21165 images).
- subset_saved_5_fold_resnet50_results.csv: Saved 5-fold CV results of ResNet-50 on a subset (2500 images) of the dataset.
- subset_saved_5_fold_densenet121_results.csv: Saved 5-fold CV results of DenseNet-50 on a subset (2500 images) of the dataset.
- saved_5fold_gridsearch_with_8_searches.csv: Saved Grid Search results using 5-fold CV on a subset (2500 images) of the dataset.
- with_raw_outputs_saved_5_fold_densenet121_results.pkl: Pickled 5-fold CV results of DenseNet-121 on the whole dataset (21165) images. The raw outputs from the models are used for computing AUC and plotting the ROC curve.
- COVID-19_Radiography_Dataset.zip: The copy of the original dataset.
This project serves as a good introduction to using CNN in classifying pneumonia infection using CXR. Additionally, it is also the first Ipython Notebook that provides a comprehensive review of the COVID-19 Radiography dataset and achieves state-of-the-art results on the Radiography classification problem.
The existing notebooks on the Kaggle either work on a subset of the dataset [4][5] or lack results and explanation to their methodology [6].
[1] Chowdhury, M.E.H., et al., “Can AI help in screening Viral and COVID-19 pneumonia?” IEEE Access, Vol. 8, 2020, pp. 132665 - 132676. https://ieeexplore.ieee.org/document/9144185
[2] Rahman, T., et al., 2020. Exploring the Effect of Image Enhancement Techniques on COVID-19 Detection using Chest X-ray Images. https://www.sciencedirect.com/science/article/pii/S001048252100113X?via%3Dihub
[3] Ruiz, P., "Understanding and visualizing DenseNets", https://towardsdatascience.com/understanding-and-visualizing-densenets-7f688092391a
[4] Devireddy, N., "SMAI Project Kaggle dataset", https://www.kaggle.com/naren10/smai-project-kaggle-dataset
[5] Antoni, J., et al., "Assessment-Lungs X-ray Class COVID-Pneumonia", https://www.kaggle.com/jcastanonv/lungs-x-ray-class-covid-pneumonia/
[6] Maniyar, S., "Classification of COVID-19 using CNN" https://www.kaggle.com/sejalanishmaniyar/classification-of-covid-19-using-cnn