Repository for R package repDiagnosis and R shiny app for live replication diagnosis tools. This package accompanies the paper "Diagnosing the role of observable distribution shift in scientific replications" by Ying Jin, Kevin Guo and Dominik Rothenhäusler. [Reference]
Rshiny app. To quickly get started with our method, we recommend you visit our interactive Rshiny app and play with our preloaded clean datasets. Our Rshiny app is useful if you want to quickly diagnose your replication study pairs with easy-to-use features, such as live displaying and visualizing data, specifying your study, automatically checking regression in two studies, etc., or if you want to probe the generalizability of your single study (this function is not in our package and paper). [Link to Rshiny app]
Dataset collection. In a sibling Github repository awesome-replicability-data, we collect individual-level data for 11 original-replication study pairs from publicly available sources, and 5 one-sided replication studies. Visit our data collection to explore these datasets and our pre-processed clean versions.
- Install the devtools package using
install.packages("devtools"). - Install the latest development version using
devtools::install_github("ying531/repDiagnosis").
We walk through the replication study on EMDR and misinformation to show the use of our method, which decomposes the discrepancy between original and replication study estimates into several interpretable pieces (for details and cleaned datasets, see Data pair 3 in our dataset collection).
Load datasets. First, the paired datasets can be directly loaded from the package. Use data() to load them as org.dat for original study and rep.dat for replication study. You can also use your own datasets, but make sure their column names are consistent.
data("emdr_misinfo")Specify regression. In this study, the regression of interest is totalcorrect on the treatment indicator named condition. Specify the regression formula as you do for linear models, and specify the treatment variable name.
analysis_formula = "totalcorrect ~ condition"
treatment_variable = "condition"
Specify covariates and mediators. Suppose you are interested in the heterogeneity between two studies captured by covariates age and gender. Also, you wonder whether the mediators postvividness and postemotionality capture any more heterogeneity. Specify these quantities as vectors.
covariates = c("age", "gender")
mediators = c("postvividness", "postemotionality")
Specify group IDs for clustered experiments. This is not needed for this dataset. If you like, you can also specify group IDs as X, which is a redundant variable that indicates the participant ID.
Run the decomposition. Finally, call our analysis function to run the diagnosis. It returns a summary table and a decomposition plot similar to our paper. By default, it also computes post-selective CIs that are valid at 1-alpha level after adjusting for the publication bias (i.e., only publishing p-values smaller than pub_pvalue_threshold whose default value is 0.05).
set.seed(1)
results = run_diagnosis(
  org_df = org.dat, # data frame for original study
  rep_df = rep.dat, # data frame for replication study
  analysis_formula = analysis_formula, # regression formula
  treatment_name = treatment_name, # column name of treatment indicator
  focal_variable = NULL, # focal variable, set as treatment_name if NULL
  covariates = covariates, # covariates to balance
  mediators = mediators, # mediators to balance
  cluster_id = "X", # can also be set to NULL in this case
  selection_variable = NULL, # variable on which the selection happens, set  treatment_name if NULL
  alpha = 0.1, # confidence level for all CIs
  verbose = TRUE, # printing the tables and plots
  if_selective = TRUE, # conduct the selective inference CIs
  pub_pvalue_threshold = 0.05 # p-value threshold for publication bias
)
Display information.
If verbose=TRUE, it will display the progress of jackknife for computing SEs, and print a message for how the selection adjustment is conducted. In this example, it displays:
Jackknifing [============================================================>] 100%

Message for selective inferece:
NOTE: Running selective inference conditional on p <= 0.05!
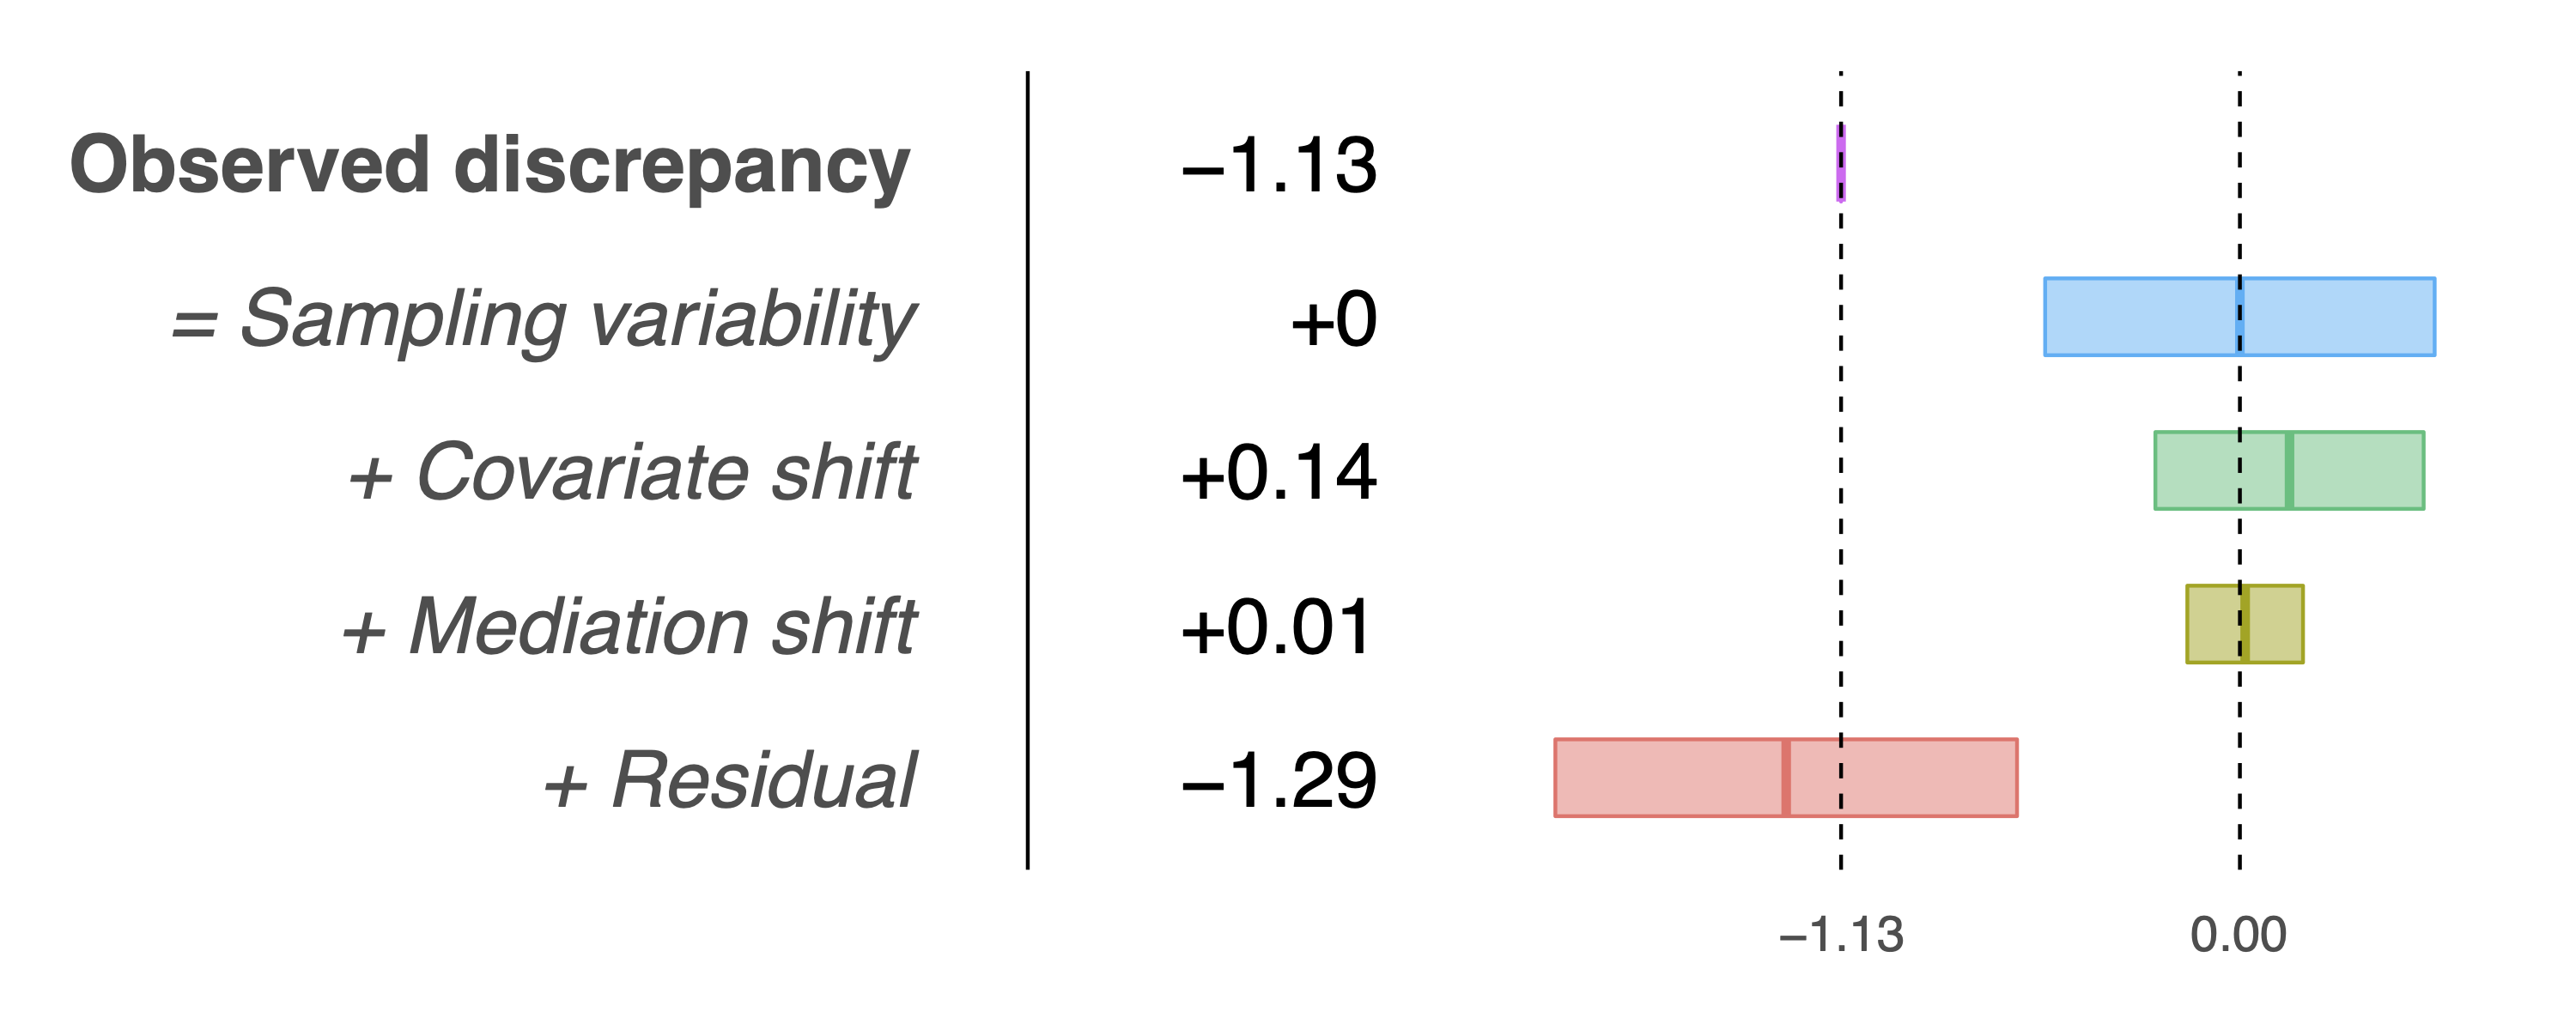
Table and plot.
The object results contain a summary table of decomposition and a decomposition plot as in our paper, and their counterparts after adjusting for publication bias. It also returns the message for how the selection adjustment is conducted.
> results$table
                     Estimate Std. Error  t-stat Pr(>|z|)
Observed discrepancy  -1.1321     0.3361 -3.3681   0.0008
Covariates             0.1409     0.2315  0.6085   0.5428
Mediators              0.0150     0.0998  0.1500   0.8808
Residual              -1.2879     0.3984 -3.2328   0.0012
and the following decomposition plot:
Selection-adjusted table and plot.
If if_selective=TRUE, it runs selective inference procedures. It will additionally display the following summary table:
> results$sel.table
                      CI.Low CI.High Estimate
Observed discrepancy -1.6850 -0.5427  -1.1321
Covariate shift      -0.2399  0.5216   0.1409
Mediation shift      -0.1492  0.1792   0.0150
Residual             -1.9433 -0.6188  -1.2831
and the following decomposition plot that adjusts for publication bias:
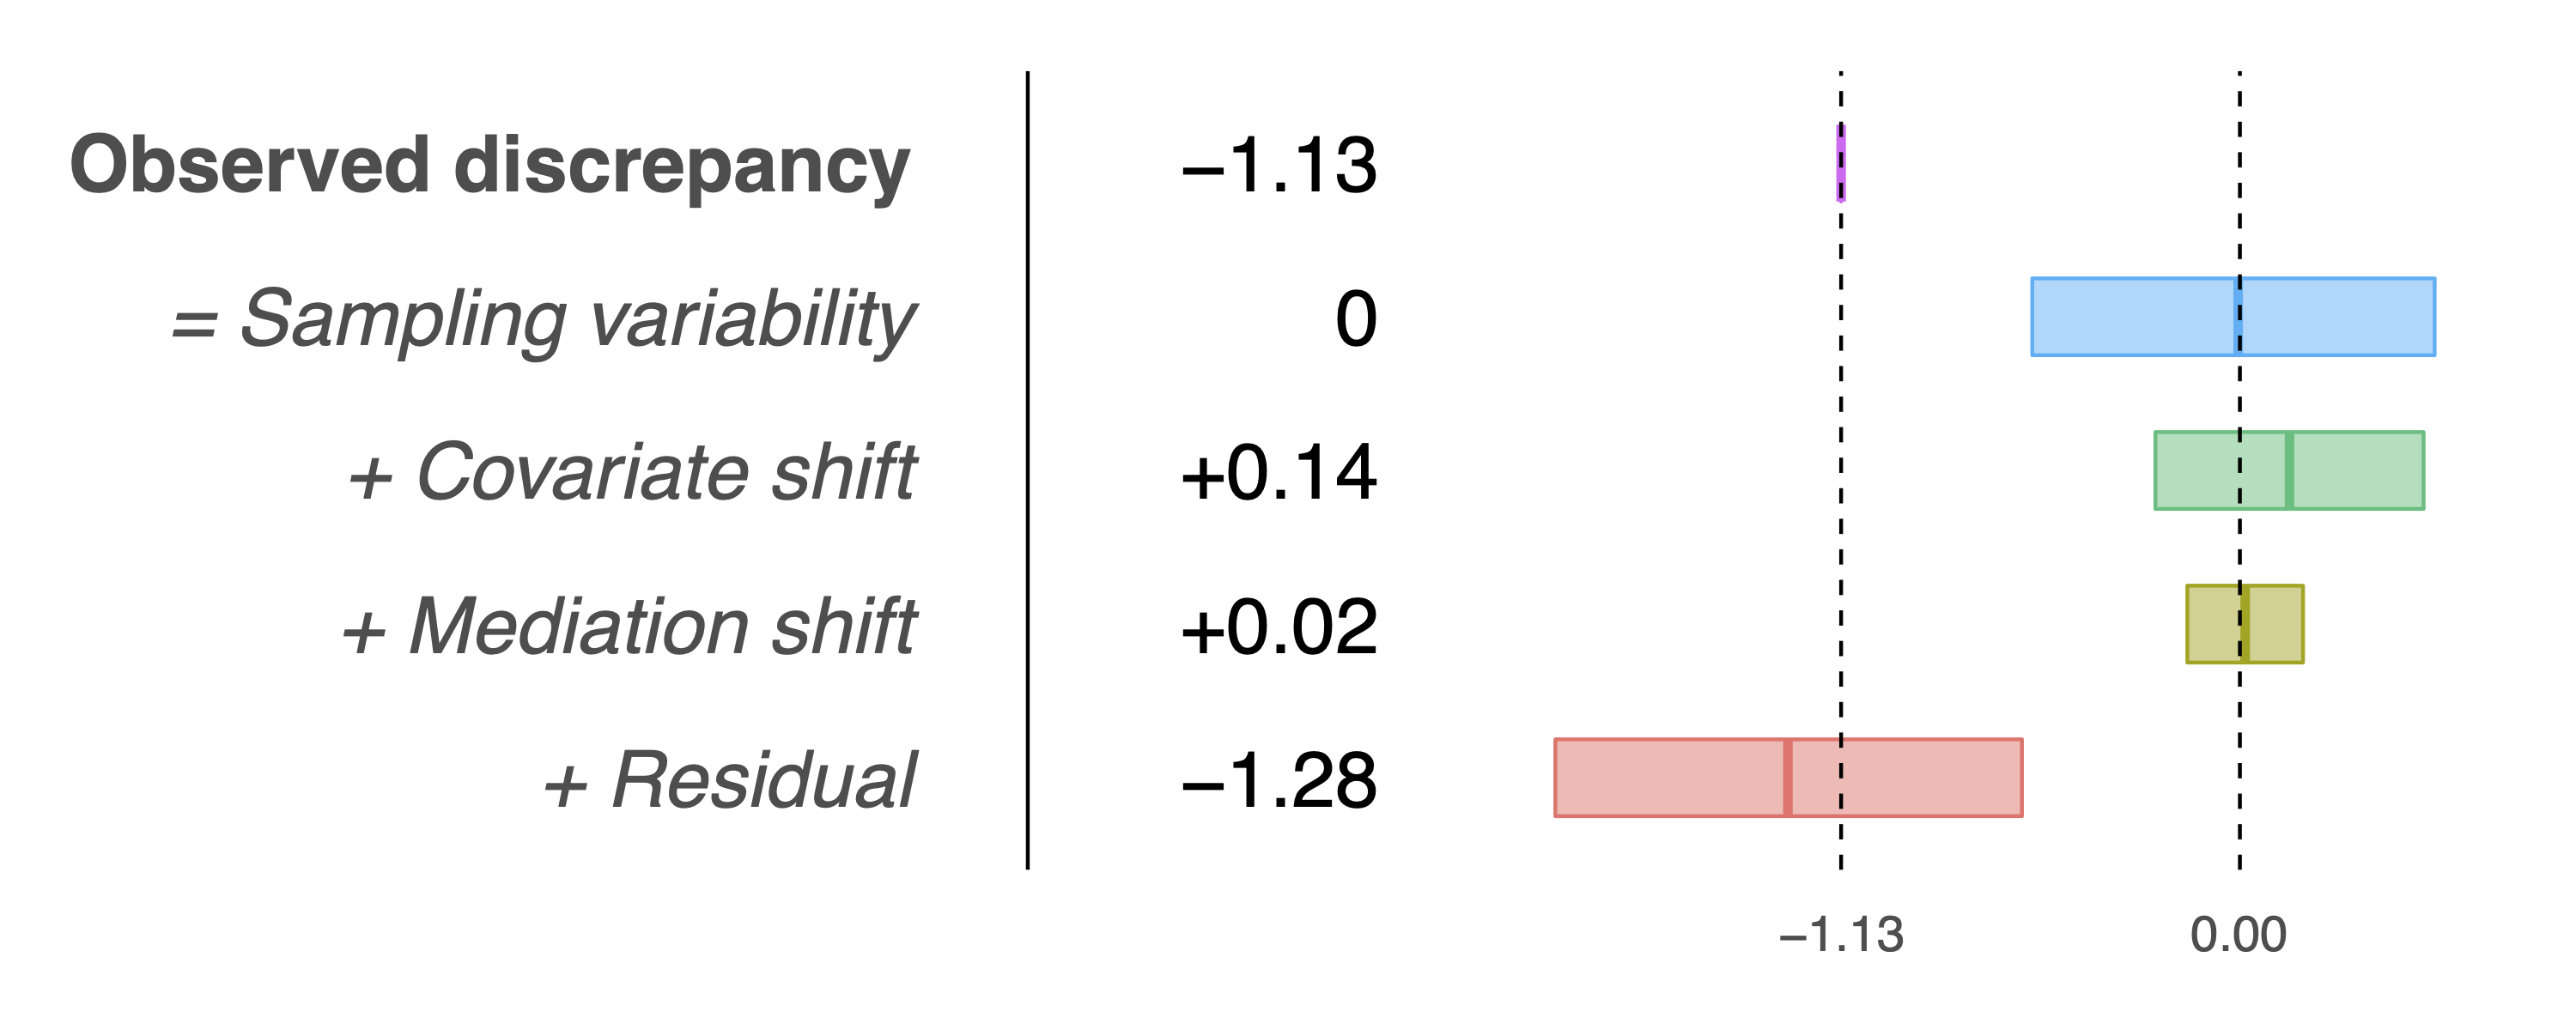
This plot does not differ much from the first because the original p-value is tiny, hence adjusting for publication bias does not change things too much.
run_diagnosis <- function(
    org_df,
    rep_df,
    analysis_formula,
    treatment_variable,
    focal_variable = NULL,
    covariates = NULL,
    covariate_formula = NULL,
    mediators = NULL,
    mediation_formula = NULL,
    cluster_id = NULL,
    selection_variable = NULL,
    alpha = 0.1,
    verbose = TRUE,
    if_selective = TRUE,
    pub_pvalue_threshold = 0.05
)
This function takes two data.frame's for the original study and replication study as input, and conducts the replicability decomposition on the fitted coefficient for focal_variable in a linear regression with analysis_formula. If if_selective == True, then it conducts post-selection inference for the decomposition given that the p-value for selection_variable is smaller than pub_pvalue_threshold.
Below we describe in details how the arguments should be specified.
| Arguments | Description |
|---|---|
org_df |
Dataframe for individual-level data in the original study |
rep_df |
Dataframe for individual-level data in the replication study; must match the format of org_df for features involved in the analysis |
analysis_formula |
The analysis formula for the regression, such as "outcome ~ treatment" |
treatment_variable |
The column name for the treatment indicator (1=treatment) |
focal_variable |
Optional, Optional, string for the column name of the variable on which the decomposition is conducted; if not specified, it will be set as treatment_variable |
covariates |
Optional, vector for column names or column number of covariates to balance |
covariate_formula |
Optional, formula for covariates to balance. - For instance, to balance age and gender, you can take it as "~ age + gender", or "~(age+gender) * treatment" meaning that they are balanced in each arm; the two choices should not differ significantly. - If both covariates and covariate_formula are specified, covariate_formula will be taken. - In our implementation, taking covariates = c("age", "gender") is equivalent to covariate_formula = "~ (age+gender) * treatment". |
mediators |
Optional, vector for column names or column number of mediators to balance |
mediation_formula |
Optional, formula for mediators to balance, which should also include covariates. - For instance, if you want to balance my_mediator on top of age and gender, the mediation formula should be "~ (age + gender + mymediator) * treatment", which means "mediator" is viewed as a mediator to balance. - If both mediators and mediation_formula are specified, mediation_formula will be taken. |
cluster_id |
Optional, string for the column name of the cluster id in the studies (specify if the study is clustered) |
selection_variable |
Optional, string for the column name on which the publication bias happens; if not specified, it will be set the same as focal_variable |
alpha |
Optional, the confidence level for the confidence intervals, = 0.1 by default |
verbse |
Optional, = TRUE by default; print the Jackknife progress and selective inference message if verbose == TRUE |
if_selective |
Optional, = TRUE by default; conduct post-selective inference for publication bias if `if_selecitve == True |
pub_pvalue_threshold |
Optional, = 0.05 by default; the p-value threshold for publication bias adjustment. Selective inference will stop and return a message if the p-value in the original study for focal_variable is smaller than this value. |
Below are the outputs in the returned list by the function.
| Output | Description |
|---|---|
plot |
Decomposition plot without publication bias adjustment |
table |
Summary table without publication bias adjustment |
sel.plot |
Decomposition plot with publication bias adjustment; will be NULL if selective inference is not run or post-selection intervals are too wide (outside of estimate += 256 * SE) |
sel.table |
Summary table with publication bias adjustment; shows -Inf and Inf for confidence intervals if no meaningful CIs are found within estimate += 256 * SE |
sel.message |
Messages for selective inference, including how it is conducted and whether any CI is too wide; will be displayed if verbose==TRUE |
Please use the following citation if you use this collection in your study, or you use our softwares for analyzing replication studies.
@article{jin2023diagnosing,
  title={Diagnosing the role of observable distribution shift in scientific replications},
  author={Jin, Ying and Guo, Kevin and Rothenh{\"a}usler, Dominik},
  journal={arXiv preprint arXiv:2309.01056},
  year={2023}
}