March 25, 2021 Update: We are winding down our work on COVID-19 and hence will no longer be updating the evaluations. See Youyang's blog post for more details. Our final evaluations will go through March 6, 2021. For an alternative evaluation framework, we recommend the COVID-19 Forecast Hub by the Reich Lab (UMass Amherst) and Delphi Group (CMU).
February 9, 2021 Update: We have released long-term forecast evaluations (6 to 20 weeks ahead) in our summary directory.
Here we present an evaluation of models from the COVID-19 Forecast Hub. These models are submitted weekly to the CDC COVID-19 Forecasting page to help inform public health decision-making.
While a model's future projections can be useful, it is also important to take into account the model's historical performance in a transparent, rigorous, and non-biased manner. This is the goal of this project.
In this repository, we provide the evaluation results as well as the entire source code to replicate the evaluations and summaries.
Evaluations are done weekly and summarized in the summary directory. You can view the outputs of the individual evaluations in the evaluations directory.
Full disclosure: This evaluation was developed by Youyang Gu, whose model 'YYG / covid19-projections.com' is one of the models in the COVID-19 Forecast Hub.
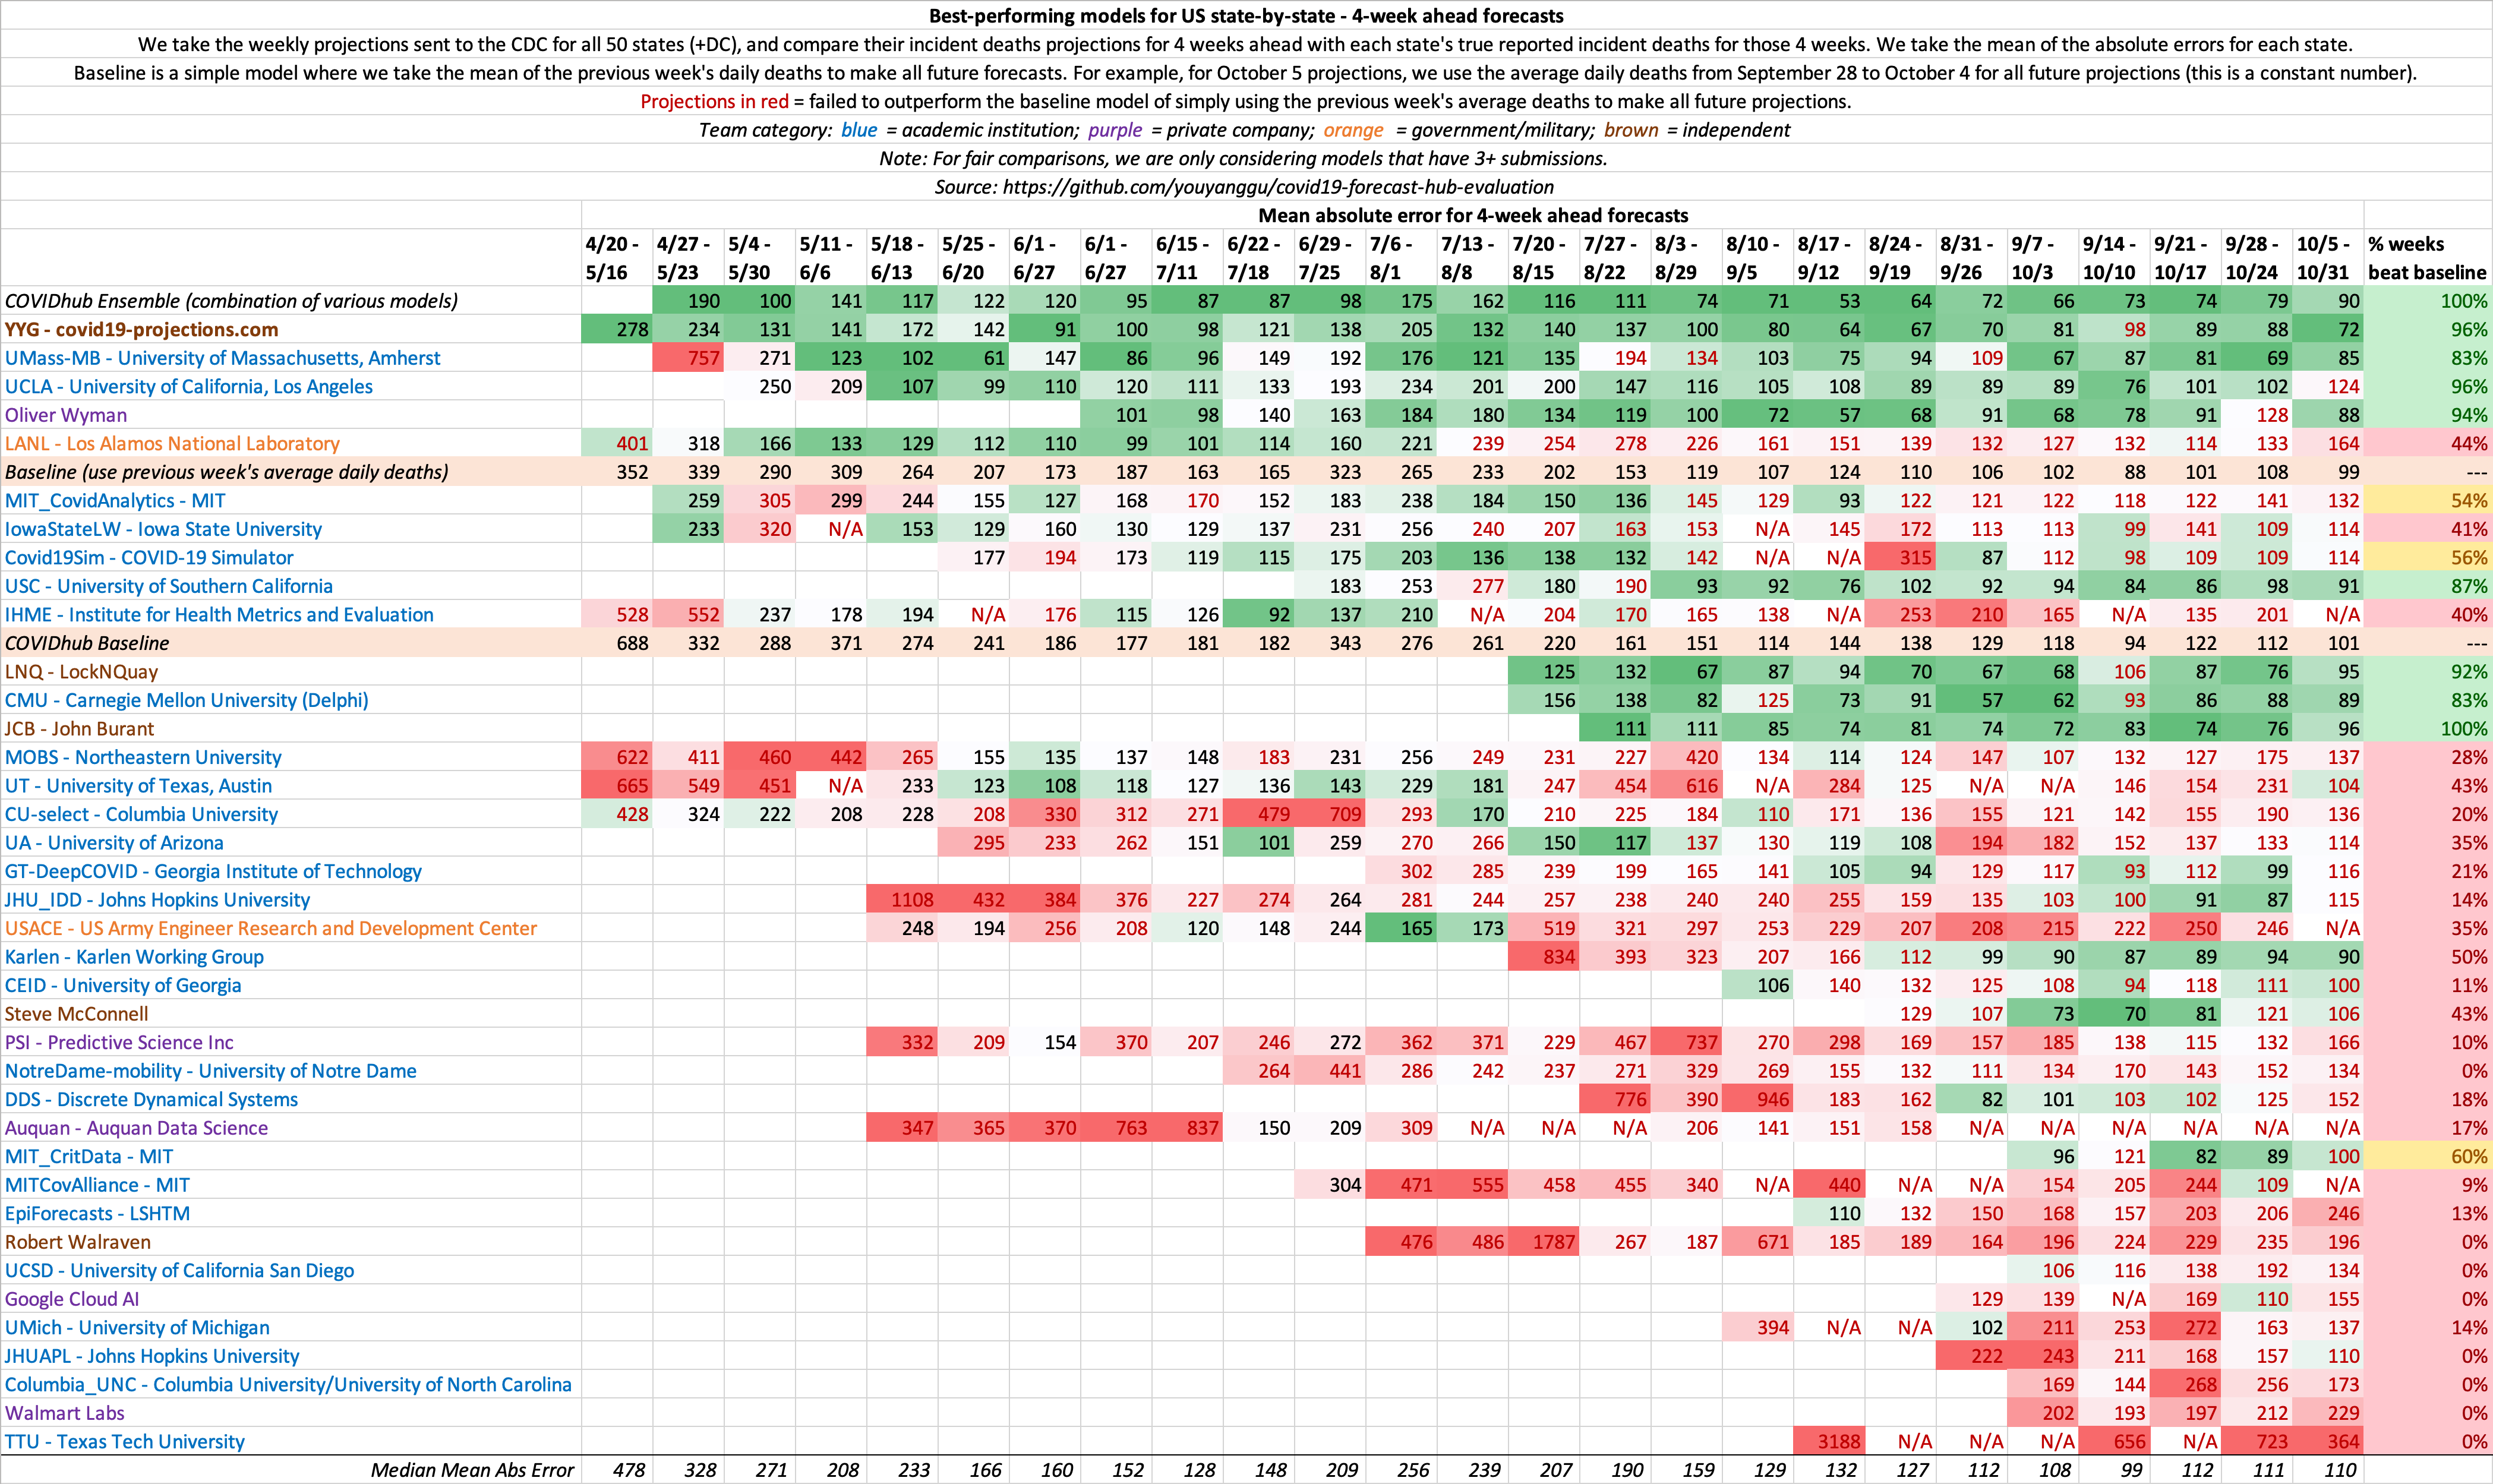
4 week ahead state-by-state evaluations:
4 week ahead US nationwide evaluations:
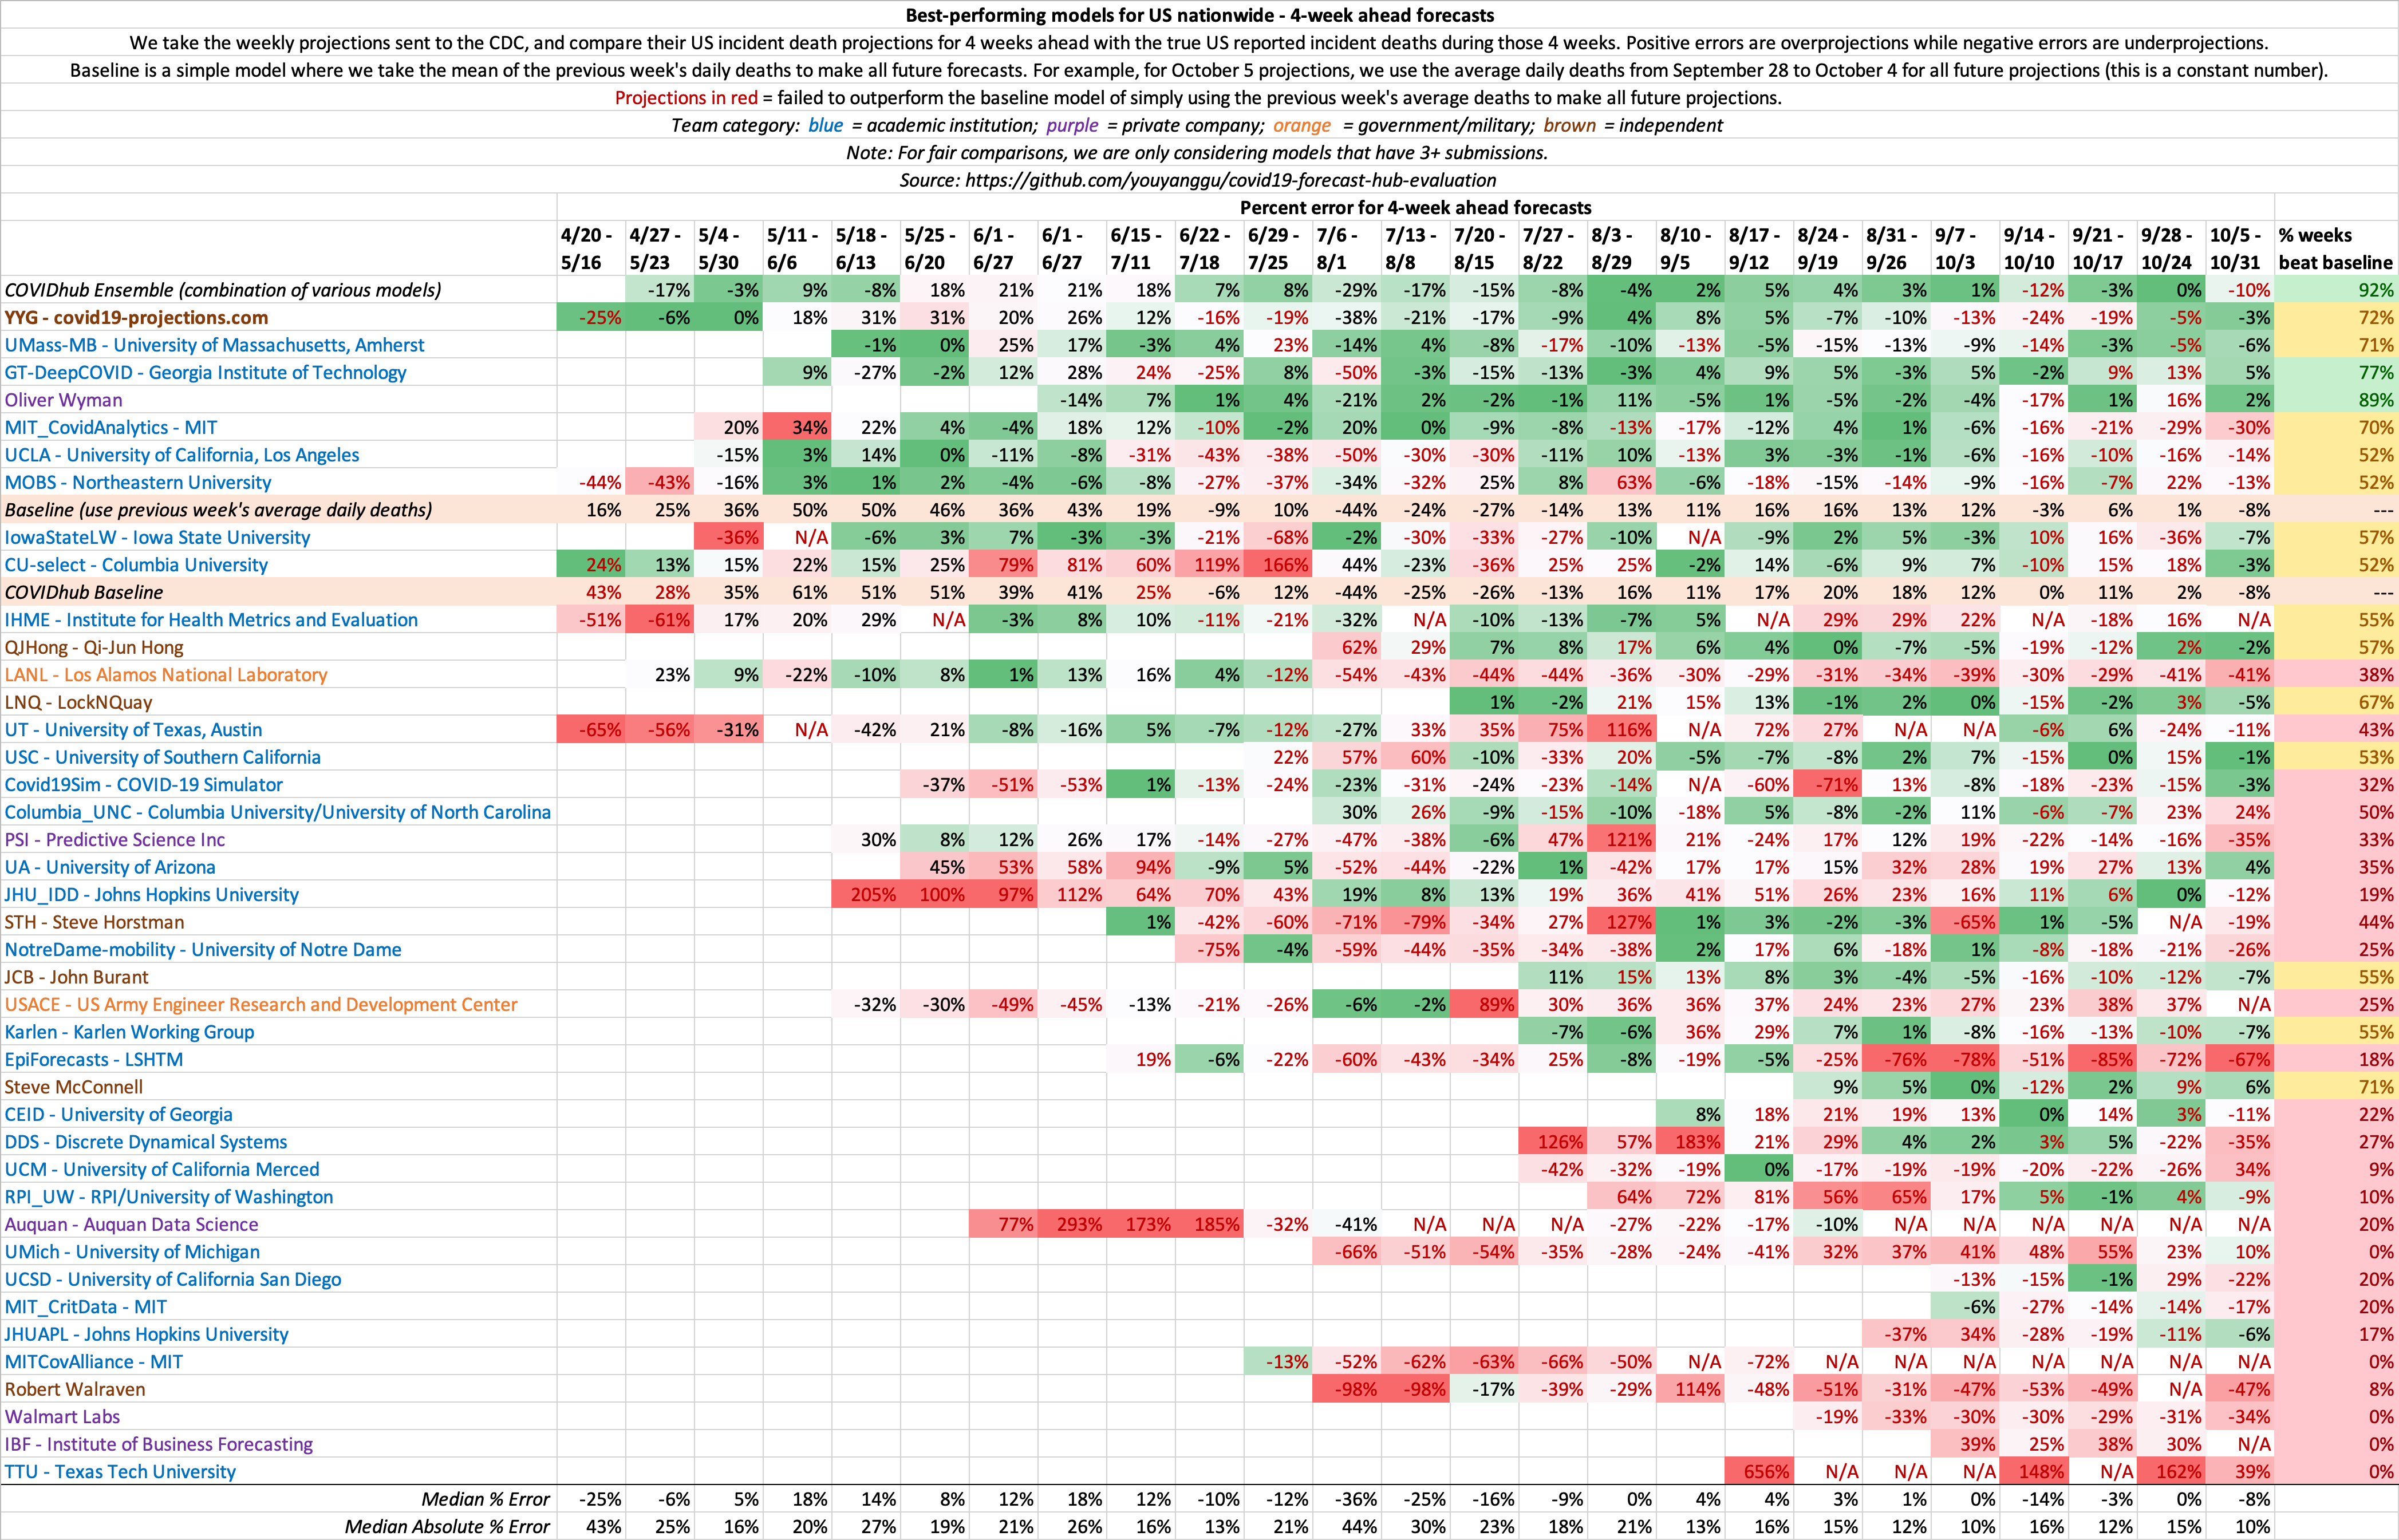
Table of Contents
We provide the entire source code to replicate the evaluation results. Below are the dependencies necessary.
You need Python 3 with the NumPy and pandas packages.
Once you have Python 3, you can install the NumPy and pandas packages by running the following command:
pip install numpy pandas
Note: This was built and tested on Python 3.8.0, NumPy 1.19.2, and pandas 1.1.2. It's possible that an older/newer versions may not be compatible.
You also need to download the COVID-19 Forecast Hub data, which contains the raw forecasts from each model. We recommend cloning the repository:
git clone https://github.com/reichlab/covid19-forecast-hub.git
- Make sure the dependencies (NumPy/pandas) are installed:
pip install numpy pandas - Clone this repository:
git clone https://github.com/youyanggu/covid19-forecast-hub-evaluation.git - Clone the COVID-19 Forecast Hub repository:
git clone https://github.com/reichlab/covid19-forecast-hub.git - (Optional) Make sure that the COVID-19 Forecast Hub and this repository share the same parent. Otherwise, you would need to pass in the Forecast Hub location via the
--forecast_hub_dirflag. - Pick a Monday for the projection date (when the forecasts were generated), and pick a Saturday to evaluate those projections (e.g. Monday May 4 and Saturday June 13). We explain the reasoning for this below.
- Run the evaluation:
python evaluate_models.py 2020-05-04 2020-06-13. You can view a list of sample commands here. - (Optional) After you have generated several evaluations, you can summarize the evaluations:
python summarize_evaluations.py --weeks_ahead 4. You can view a list of sample commands here.
We call evaluate_models.py to compute an evaluation based on a projection date-evaluation date pair. Note that the projection date must be a Monday and the evaluation date must be a Saturday due to reasons explained below.
python evaluate_models.py 2020-05-04 2020-06-13
By default, it checks the local directory for covid19-forecast-hub.
python evaluate_models.py 2020-05-04 2020-06-13 --forecast_hub_dir /PATH/TO/covid19-forecast-hub
python evaluate_models.py 2020-05-04 2020-06-13 --out_dir evaluations/
python evaluate_models.py 2020-05-04 2020-06-13 --truth_file truth/truth-cumulative-deaths-latest.csv
For most models, this makes no difference.
python evaluate_models.py 2020-05-04 2020-06-13 --use_median
python evaluate_models.py 2020-05-04 2020-06-13 --print_additional_stats
Compute errors by using the cumulative deaths on the evaluation date rather than incident deaths. The difference is explained in greater detail below.
python evaluate_models.py 2020-05-04 2020-06-13 --use_cumulative_deaths
This is the command that generated all of the files in the evaluations directory.
. evaluation_cmds.txt
We call summarize_evaluations.py to summarizes the individual evaluations generated from above.
python summarize_evaluations.py --weeks_ahead 4
python summarize_evaluations.py --eval_date 2020-06-13
The evaluations directory is the output of the evaluate_models.py script (default is simply the evaluations/ directory).
python summarize_evaluations.py --weeks_ahead 4 --evaluations_dir /PATH/TO/evaluations
python summarize_evaluations.py --weeks_ahead 4 --out_dir summary/
This is the command that generated all of the files in the summary directory.
. summary_cmds.txt
Models in the COVID-19 Forecast Hub submit their forecasts every Monday to be sent to the CDC. To be declared valid, a model must have 1-4 week ahead forecasts. For these week-ahead forecasts, all models use the specification of epidemiological weeks (epiweek) defined by the CDC. Because each epiweek ends on Saturday, all models are also evaluated on Saturdays. For example, if a model submits a forecast on Monday, June 15, a one week ahead forecast corresponds to the forecast ending on Saturday, June 20. A two week ahead forecast corresponds to Saturday, June 27, and so forth. This is explained in more detail in the COVID-19 Forecast Hub README.
To summarize, due to the reason above, we standardize all projection dates to be on Mondays and all evaluation dates to be on Saturdays.
An entire list of models and teams is presented on the COVID-19 Forecast Hub page. For more details on an individual team's model, you can look for the metadata file in the data-processed directory of the Forecast Hub (example: COVIDhub Ensemble metadata).
The COVIDhub ensemble model is a model created by the Reich Lab that takes a combination of all models that submit eligible projections to the Forecast Hub. You can see which models are included and their corresponding weights here.
When doing evaluations I think it's important to consider only one model per team. If a team submits 10 different models each with a different forecasts, then they will undoubtedly have a higher chance of having a more accurate model compared to a team that only submits a single forecast. That's why the COVID-19 Forecast Hub asks every team to designate only a single model to include in forecasts sent to the CDC. And so we are only consider that particular model in the evaluation.
As described in the COVID-19 Forecast Hub README, all forecasts are compared to the Johns Hopkins University CSSE Time Series Summary as the gold standard reference data for deaths in the US. This truth data can be found in the Forecast Hub data-truth directory.
We use the latest truth data from the Forecast Hub directory at the time the evaluation is run. This is saved to truth/truth-cumulative-deaths-latest.csv for deaths and truth/truth-incident-cases-latest.csv for cases. To replicate our evaluations exactly, you can use the --truth_file flag to specify the truth file used to produce the evaluations (i.e. --truth_file truth/truth-cumulative-deaths-latest.csv). Without the --truth_file flag, it will use the latest truth file from the Forecast Hub repository, which may be different than the one used to generate the evaluations.
Because the truth data can be retroactively updated, we keep copies of past truth files in the truth directory. To compute the baseline and incident deaths, we use these historical truth files (available at the time the projections were made) to avoid look-ahead bias. This is not an issue for evaluations of cases because we use the incident cases directly. See the next section for why.
To compute all of our evaluations, we use incident deaths and cases between two dates. For case evaluations, we directly use the incident cases for both the forecasts and truth, so the computation is very simple and straightforward. This is because all case forecasts submitted by teams contain incident case targets. However, this is not the case for deaths (no pun intended).
While the first case forecasts began in July, the first death forecasts began three months earlier in April. At that time, the concept of N week ahead incident death has not become standardized. For example, some forecasts from April only had N day ahead cumulative death targets. Therefore, we cannot directly compare these targets to the ground truth for weekly incident deaths. In order for us to compute the incident deaths between two dates (the projection and evaluation dates), we must take the cumulative death forecast for the evaluation date and subtract the true cumulative deaths as of the projection date. This gives us an approximation for the incident deaths between two dates, which we then compare to the incident deaths from the ground truth (between the same two dates). We explain the methodology in the next section.
If models are correctly calibrated to the Johns Hopkins data source, this method of computing the incident deaths should give a very similar result to the method of directly comparing incident death targets (if the target is available). The one minor discrepancy that may happen is for 1 wk ahead targets. This is because we compute the incident deaths between the projection and evaluation date, which is Monday-Saturday rather than Sunday-Saturday. Since Sunday reporting is often lower than average, this can skew the evaluations by a small amount (~4% difference on average). This difference becomes much more minor for targets beyond 1 week (2% for 2 weeks, 1% for 3 weeks, etc).
For simplicity purposes we will be comparing the point forecast to the truth data described above. The point forecast is almost always the mean or median estimate of the model.
There are more advanced techniques for scoring forecasts that take advantage of quantile estimates, but we will leave that as a future extension.
For US country-wide forecasts, we compute the error for each model's point forecasts using the following formula:
true_incident_deaths = true_deaths_eval_date - true_deaths_day_before_proj_date
predicted_incident_deaths = predicted_deaths_eval_date - past_true_deaths_day_before_proj_date
error = predicted_incident_deaths - true_incident_deaths
perc_error = error / true_incident_deaths
where
true_deaths_eval_date= the actual cumulative deaths on the evaluation date, based on the latest truth datatrue_deaths_day_before_proj_date= the actual cumulative deaths on the day before projection date, based on the latest truth datapredicted_deaths_eval_date= the forecasted cumulative deaths on the evaluate datepast_true_deaths_day_before_proj_date= the actual cumulative deaths on the day before projection date, based on the truth data from the projection date
So for example, if our projection date is Monday, June 1 and our evaluation date is Saturday, June 13, below is a sample of how we compute the error for a sample forecast (from the COVIDhub Ensemble model). Note that we use the cumulative deaths from the day before the projection date, May 31, to compute the incident deaths.
| Example | |
|---|---|
| June 13 US true deaths (latest truth) | 116,084 |
| May 31 US true deaths (latest truth) | 105,364 |
| True incident deaths | 10,720 (116,084 - 105,364) |
| Model cumulative deaths forecast for June 13 | 115,966 |
| May 31 US true deaths (as of June 1) | 104,381 |
| Predicted incident deaths | 11,585 (115,966 - 104,381) |
| Error | 865 (11,585 - 10,720) |
| % Error | 8.1% (865 / 10,720) |
In addition to US country-wide forecasts, we also evaluate state-by-state forecasts for all 50 states plus DC. In this section, we only evaluate models that have >1 week ahead forecasts for more than 40 states.
Using the point forecast for every model, we compute the error for each state using the same formula as the US nationwide evaluations above:
true_incident_deaths = true_deaths_eval_date - true_deaths_day_before_proj_date
predicted_incident_deaths = predicted_deaths_eval_date - past_true_deaths_day_before_proj_date
error = predicted_incident_deaths - true_incident_deaths
We then compute the mean absolute error and mean squared error for all states for every model. For models with missing state projections, we substitute the error with the mean absolute error for that state (among all the models).
We use mean absolute error rather than mean absolute percentage error because percentages are not the best way to measure error across states. For a small state such as North Dakota, predicting 2 deaths when the true value is 1 death would lead to a 100% error, but an absolute error of just 1. Conversely, predicting 1000 deaths for New York when the actual value is 2000 would lead to a 50% error, but an absolute error of 1000. Intuively, the North Dakota forecast should be considered more accurate than the New York forecast, despite it having twice the percentage error.
In any evaluation, it is important to include a baseline as a control, similar to how scientfic trials include a placebo. We define a simple baseline model that takes the mean of the previous week's daily deaths to make all future forecasts. For example, for Monday, May 25 projections, we use the average daily deaths from May 18 to May 24 to make forecasts. For US country-wide projections, this would amount to a constant 1,164 deaths per day for each forecast day.
Note that to avoid look-ahead bias, we use the previous week's daily deaths at the time of the projection is made, rather than at the time of the evaluation. Because truth data can be retroactively updated, we want to avoid using future data to generate the baseline forecasts.
Starting in July, the COVID-19 Forecast Hub began accepting incident case forecasts. You can find our evaluation of these forecasts for the subset of teams that contributed cases forecasts in the cases directory. Cases forecasts are available for US nationwide, state-by-state, and county-by-county.
The methodology for the evaluation of cases is slightly simplier, as all models provide weekly incident case forecasts. We simply compute the incident weekly cases and compare them to the latest truth data.
In addition to US forecast evaluations, we also include evaluations of country-by-country forecasts by covid19-projections.com and IHME. Because global forecasts are not standardized, each team's forecasts must be downloaded and processed separately. We compare both models with the baseline model (explained above). You can view the results in the global directory.
We summarize the weekly evaluations in the summary directory. There are two types of summaries:
-
N week ahead - these evaluate model projections for N weeks in the future, where N is between 1 and 20. Note of caution: we believe forecasts more than 6 weeks into the future are more reliant on assumptions than actual signals, so please use those results carefully.
-
Evaluation date - these evaluate model projections for a particular date. So if the evaluation date is October 31, this summary ranks models based on their past weekly projections for October 31. Hence, this metric looks at the accuracy of a model's forecasts for a particular date.
For each type of summary, we create further subdivisions based on US nationwide, state-by-state, and county-by-county (cases only) evaluations.
For each summary, each column represents the weekly errors for each model. We then rank the models based on their mean weekly percentile across all the weeks in the summary.
To compute percentiles for a particular column/week, we assign the best model that week the 0th percentile and the worst model the 100th percentile. For example, if a model has four forecasts in a summary and ranks 11/21, 5/21, 15/25, and 7/27, then its weekly percentiles are 0.5, 0.2, 0.58, 0.23. Its mean weekly percentile is 0.378, meaning that on average this model is in the 38th percentile of models (top half).
Models with no forecasts for a particular week is assigned the 100th percentile (lowest score). The lone exception is if a model stops making forecasts, in which case we simply ignore all subsequent missing forecasts from the calculations.
A byproduct of this method is that we are rewarding models for submitting forecasts and submitting their forecasts early. A model is much more useful if it began making forecasts in April than in July. When there are very few models in the early stages of the pandemic, each model's forecasts carry much more weight and usefulness. We believe this most accurately balances the time/complexity trade-off: you can make models more complex/accurate at the expense of development time.
We have published our Model Power Rankings that combines model performances for 1-6 week ahead US and state-by-state forecasts, based on its rankings on each of the 12 N week ahead summary files.
The source code to compute the power rankings is available here.
We encourage open collaboration. Please open an issue request if you have any questions/suggestions/bug reports.