Skip to content
New issue

Have a question about this project? Sign up for a free GitHub account to open an issue and contact its maintainers and the community.

By clicking “Sign up for GitHub”, you agree to our terms of service and privacy statement. We’ll occasionally send you account related emails.

Already on GitHub? Sign in to your account

Warning when making dotplot from gseaResult #22

Closed
millerh1 opened this issue May 24, 2019 · 19 comments
Closed

Warning when making dotplot from gseaResult #22

millerh1 opened this issue May 24, 2019 · 19 comments

Comments

@millerh1
Copy link

Hello! This has only been occurring recently -- but dotplot throws a strange warning when applied to objects of 'gseaResult' ---

wrong orderBy parameter; set to default orderBy = "x"

orderBy appears to be an internal parameter, so it's a bit confusing to get this error when it doesn't appear that there was an obvious way to set 'orderBy' in the first place.

Anyways -- also wanted to say I love the clusterProfiler/enrichPlot suite of tools, thank you for all the work your team does!! Hope this helps!

Reproducible example:

Quiescent.vs.Proliferative.Raw.Counts.txt

# Wrangle count data
counts <- read.table("Data/Quiescent.vs.Proliferative.Raw.Counts.txt", header = T, row.names = 1)
colData <- data.frame(sample = colnames(counts), condition = c(rep("Quiescent", 3), rep("Proliferative", 3)))
colData$condition <- factor(colData$condition, levels = c("Quiescent", "Proliferative"))
dds <- DESeqDataSetFromMatrix(countData = counts, colData = colData, design = ~condition)

# QC
keep <- rowSums(counts(dds)) >= 10
dds <- dds[keep,]

# DGE
dds <- DESeq(dds)
res <- results(dds, contrast = c("condition", "Quiescent", "Proliferative"))
resDF <- as.data.frame(res)
resDF$geneID <- rownames(resDF)

# wrange DGE results
ensembl <- useMart("ensembl",dataset="hsapiens_gene_ensembl", host = "useast.ensembl.org") 
map <- getBM(attributes = c("ensembl_gene_id", "description", "external_gene_name"), mart = ensembl)
colnames(map) <- c("geneID", "description", "geneName")
resDF <- merge(x = map, y = resDF, by = "geneID")
resDF <- resDF[,c(3,2,1,4:9)]
resDF$GSEA <- -log10(resDF$padj) * sign(resDF$log2FoldChange)
resDF <- resDF[order(resDF$GSEA, decreasing = T),]

# GSEA
geneList <- resDF$GSEA
names(geneList) <- resDF$geneName
geneList <- geneList[which(! duplicated(names(geneList)))]
geneList <- geneList[which(! is.na(geneList))]
TERM2GENE <- msigdbr()
TERM2GENE <- TERM2GENE[,c(1,5)]
EGMT <- GSEA(geneList = geneList, TERM2GENE = TERM2GENE, pvalueCutoff = .2)

enrichplot::dotplot(EGMT)`

wrong orderBy parameter; set to default orderBy = "x"

Session info:

R version 3.6.0 (2019-04-26)
Platform: x86_64-w64-mingw32/x64 (64-bit)
Running under: Windows 10 x64 (build 17763)

Matrix products: default

locale:
[1] LC_COLLATE=English_United States.1252  LC_CTYPE=English_United States.1252    LC_MONETARY=English_United States.1252
[4] LC_NUMERIC=C                           LC_TIME=English_United States.1252    

attached base packages:
[1] parallel  stats4    stats     graphics  grDevices utils     datasets  methods   base     

other attached packages:
 [1] pheatmap_1.0.12             biomaRt_2.40.0              msigdbr_6.2.1               tibble_2.1.1               
 [5] dplyr_0.8.1                 EnhancedVolcano_1.2.0       ggrepel_0.8.1               ggplot2_3.1.1              
 [9] clusterProfiler_3.12.0      DESeq2_1.24.0               SummarizedExperiment_1.14.0 DelayedArray_0.10.0        
[13] BiocParallel_1.18.0         matrixStats_0.54.0          Biobase_2.44.0              GenomicRanges_1.36.0       
[17] GenomeInfoDb_1.20.0         IRanges_2.18.0              S4Vectors_0.22.0            BiocGenerics_0.30.0        

loaded via a namespace (and not attached):
  [1] fgsea_1.10.0           colorspace_1.4-1       ggridges_0.5.1         qvalue_2.16.0          htmlTable_1.13.1      
  [6] XVector_0.24.0         base64enc_0.1-3        rstudioapi_0.10        farver_1.1.0           urltools_1.7.3        
 [11] bit64_0.9-7            AnnotationDbi_1.46.0   xml2_1.2.0             splines_3.6.0          GOSemSim_2.10.0       
 [16] geneplotter_1.62.0     knitr_1.23             polyclip_1.10-0        Formula_1.2-3          jsonlite_1.6          
 [21] SMVar_1.3.3            packrat_0.5.0          annotate_1.62.0        cluster_2.0.8          GO.db_3.8.2           
 [26] ggforce_0.2.2          BiocManager_1.30.4     compiler_3.6.0         httr_1.4.0             rvcheck_0.1.3         
 [31] backports_1.1.4        assertthat_0.2.1       Matrix_1.2-17          lazyeval_0.2.2         limma_3.40.2          
 [36] tweenr_1.0.1           acepack_1.4.1          htmltools_0.3.6        prettyunits_1.0.2      tools_3.6.0           
 [41] igraph_1.2.4.1         gtable_0.3.0           glue_1.3.1             GenomeInfoDbData_1.2.1 reshape2_1.4.3        
 [46] DO.db_2.9              fastmatch_1.1-0        Rcpp_1.0.1             enrichplot_1.4.0       gdata_2.18.0          
 [51] ggraph_1.0.2           xfun_0.7               stringr_1.4.0          gtools_3.8.1           XML_3.98-1.19         
 [56] DOSE_3.10.0            europepmc_0.3          zlibbioc_1.30.0        MASS_7.3-51.4          scales_1.0.0          
 [61] hms_0.4.2              RColorBrewer_1.1-2     curl_3.3               memoise_1.1.0          gridExtra_2.3         
 [66] UpSetR_1.4.0           triebeard_0.3.0        rpart_4.1-15           metaMA_3.1.2           latticeExtra_0.6-28   
 [71] stringi_1.4.3          RSQLite_2.1.1          genefilter_1.66.0      checkmate_1.9.3        caTools_1.17.1.2      
 [76] rlang_0.3.4            pkgconfig_2.0.2        bitops_1.0-6           lattice_0.20-38        purrr_0.3.2           
 [81] labeling_0.3           htmlwidgets_1.3        cowplot_0.9.4          bit_1.1-14             tidyselect_0.2.5      
 [86] plyr_1.8.4             magrittr_1.5           R6_2.4.0               gplots_3.0.1.1         Hmisc_4.2-0           
 [91] DBI_1.0.0              withr_2.1.2            pillar_1.4.0           foreign_0.8-71         survival_2.44-1.1     
 [96] RCurl_1.95-4.12        nnet_7.3-12            crayon_1.3.4           KernSmooth_2.23-15     viridis_0.5.1         
[101] progress_1.2.2         locfit_1.5-9.1         grid_3.6.0             data.table_1.12.2      blob_1.1.1            
[106] digest_0.6.19          xtable_1.8-4           tidyr_0.8.3            gridGraphics_0.4-1     munsell_0.5.0         
[111] viridisLite_0.3.0      ggplotify_0.0.3   
@millerh1 millerh1 changed the title Error when making dotplot from gseaResult Warning when making dotplot from gseaResult May 24, 2019
@GuangchuangYu
Copy link
Member

it should be fixed in recent version.

@zhaoqingbo1993
Copy link

Has this problem been solved?

@zhaoqingbo1993
Copy link

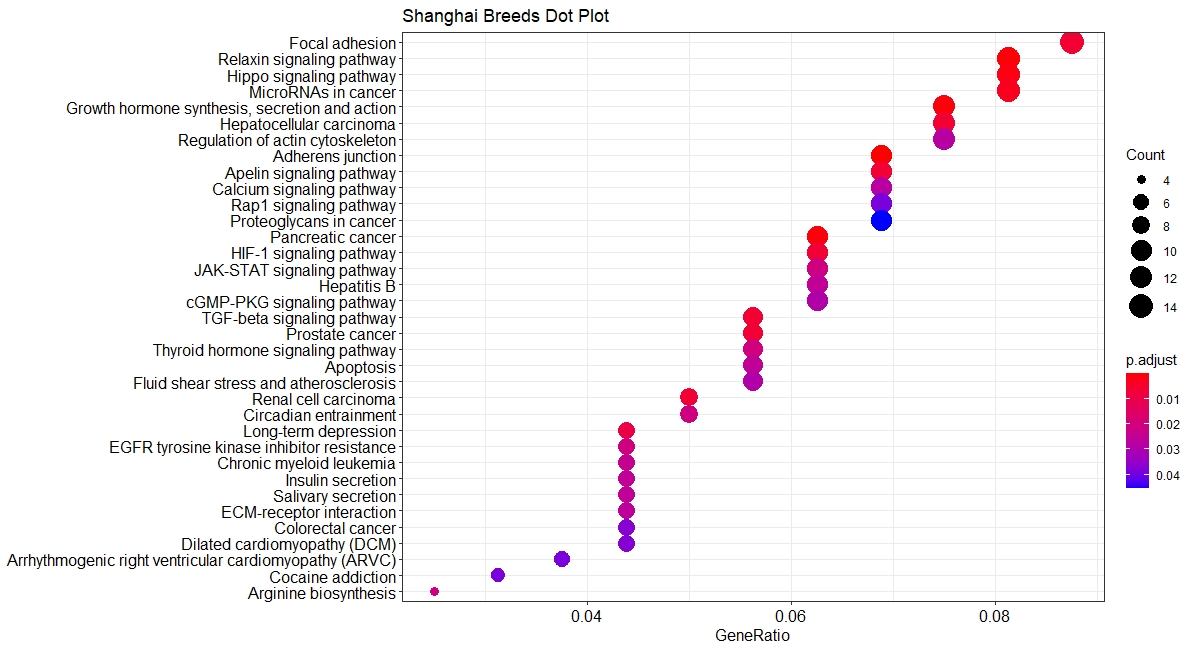
So it is fixed now? How can i adjust myplot?
Rplot01

@bounlu
Copy link

bounlu commented Jan 5, 2021

How is this solved? I still get this warning.

@jihoonk1495
Copy link

jihoonk1495 commented Jan 23, 2021

@bounlu I am also getting the same error when I am running dotplot.

I am following the vignette posted on this link:
https://learn.gencore.bio.nyu.edu/rna-seq-analysis/gene-set-enrichment-analysis/

@BirongZhang
Copy link

I am also getting the same error, how can we solve it?

ego <- enrichGO(gene = sig_genes,
universe = all_genes,
keyType = "ENSEMBL",
OrgDb = org.Hs.eg.db,
ont = "BP",
pAdjustMethod = "BH",
qvalueCutoff = 0.05,
readable = TRUE)

dotplot(ego, showCategory=50)

@hreinwal
Copy link

Same here :/ Still getting the same error.

@bounlu
Copy link

bounlu commented Feb 24, 2021

Has this problem been solved?

no

@huerqiang
Copy link
Contributor

Please use the latest version on github.

@ChristinaSchmidt1
Copy link

ChristinaSchmidt1 commented Apr 9, 2021

I am using the latest version and yet I still get this warning.
Any other advice on how to solve this?

@ge2sasag
Copy link

Same, I'm still getting this all the time.

@OliverBit
Copy link

Same

@alexandruioanvoda
Copy link

alexandruioanvoda commented Apr 24, 2021

I'm using the 1.10.2 version, latest, and I'm still getting this error all the time.

@MWSchmid
Copy link

Got the same error, but one can also just set the argument...

dotplot(myResults, showCategory=15, orderBy="GeneRatio")

@huerqiang
Copy link
Contributor

@alexandruioanvoda the latest version of enrichplot in github is 1.11.3

@nat-kreiling
Copy link

nat-kreiling commented May 13, 2021

I must be looking in the wrong place because The latest version in GitHub says 1.10.1 (https://github.com/YuLab-SMU/enrichplot) ?
I still tried updating enrichplot and am still getting this error: (even if I try specifying the orderBy argument)

barplot(ego_BP_up, showCategory=20)
Error in ans[ypos] <- rep(yes, length.out = len)[ypos] :
replacement has length zero
In addition: Warning message:
In rep(yes, length.out = len) : 'x' is NULL so the result will be NULL

Update:
Trying the Devel version 1.11.3 still gives the same error. 😪

@huerqiang
Copy link
Contributor

@nat-kreiling The class of your ego_BP_up should be enrichResult.

GuangchuangYu pushed a commit that referenced this issue Dec 29, 2021
@shanshenbing
Copy link

I use 1.15.3, and the res from enrichKEGG() is "enrichResult" obj, but I got the same warning

@huerqiang
Copy link
Contributor

I use 1.15.3, and the res from enrichKEGG() is "enrichResult" obj, but I got the same warning

Please provide your data.

Sign up for free to join this conversation on GitHub. Already have an account? Sign in to comment
Labels
None yet
Projects
None yet
Development

No branches or pull requests