This script is an implementation of an outlier detection technique described in the paper Topological Anomaly Detection Performance with Multispectral Polarimetric Imagery (2009) by Drs. Michael Gartley and Bill Basener from RIT.
The technique is essentially a density based outlier detection algorithm that, instead of calculating local densities, constructs a graph of the data using nearest-neighbors. The algorithm is different from traditional kNN outlier detection algorithms in that instead of setting 'k' as a parameter, you instead set a maximal inter-observation distance (called the graph "resolution" by Gartley and Basener). If the distance between two points is less than the graph resolution, add an edge between those two observations to the graph. Once the full graph is constructed, determine which connected components comprise the "background" of the data by setting some threshold percentage of observations 'p': any components with fewer than 'p' observations is considered an anomalous component, and all the observations (nodes) in this component are outliers.
The only tuning parameters are 'r' and 'p'. The default for 'p' is based on the recommendation in the Gartley paper, but there's no recommended heuristic for constructing 'r' so I just set it to a value that seems to work (the 10th percentile distance of the adjacency matrix).
networkxnumpypandasscipy
The pandas requirement is just a convenience to return the outlier scores as a pandas.Series. To break this requirement, modify the return value of calculate_anomaly_scores
to just return the scores variable (a dict) instead of wrapping it in a pandas.Series.
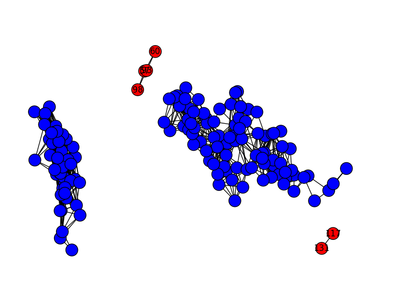
Demo usage can be found in the file demo.py. The above image demonstrates the result when TAD is applied to the Iris dataset (observation positions given by PCA).
NB: The demo requires sklearn for the iris data and for PCA.